Assurances Industrielles et Commerciales, Assinco
 Adherence to the network Globus in 2007 marked the first turning point in the company’s evolution. Hence, exactly ten years on, after the start of operations, Assinco has not only benefited from an additional premium volume driven by Globus, but it has also taken advantage from a better international visibility.
BGFI’s entry into capital in 2011 marks the second salient fact in the history of the young company. Being a reference shareholder with a 60% stake, BGFI provides a financial security and paves the way for Assinco to pursue a promising future thanks to the huge potential of bancassurance.
Another successful choice, shareholders managed the generational transition magnificently well, not hesitating to hand over the company’s reigns to a young and ambitious team. The latter’s task will consist in taking the company one step higher.
 |  |
| Richard Auguste Onouviet | Stephen Moussirou |
| Chairman of the board of directors | General manager |
Assinco in 2016
| Paid up capital | 8 040 000 USD |
| Turnover | 21 818 000 USD |
| Assets | 50 779 270 USD |
| Shareholder’s equity | 18 686 890 USD |
| Net result | 326 180 USD |
| Gross loss ratio | 34.28% |
| Gross expenses ratio | 36.36% |
| Gross combined ratio | 70.64% |
| Number of employees | 62 |
Assinco : Main shareholders
| BGFI Holding Corporation | 60% |
| Delta Synergie | 15% |
| Nahor Capital Investments | 14% |
| Bossisi Finances | 10% |
| Le temps des moissons | 1% |
Assinco : Management
| Chairman of the board of directors | Richard Auguste Onouviet |
| General manager | Stephen Moussirou |
| Accounting and administrative manager | Armel Nzigou |
| Technical manager | Ricardo Koumba |
| Brokerage manager | Adonis Oyima |
| Production manager | Teddy Lemboumba |
| Claims manager | Joseph Bayonne |
| Sales manager | Wilfrid Engouma |
Assinco: main technical highlights (2012-2016)
in millions
| 2012 | 2013 | 2014 | 2015 | 2016 | ||||||
|---|---|---|---|---|---|---|---|---|---|---|
| FCFA | USD | FCFA | USD | FCFA | USD | FCFA | USD | FCFA | USD | |
Gross written premiums | 12 551 | 25 | 16 602 | 34 | 17 637 | 32 | 17 389 | 28 | 13 568 | 21 |
Written premiums net of reinsurance | 7 284 | 14 | 9 551 | 20 | 8 283 | 15 | 7 361 | 12 | 7 741 | 12 |
Gross earned premiums | 12 837 | 25 | 15 825 | 33 | 18 615 | 34 | 16 308 | 27 | 13 428 | 21 |
Net earned premiums | 7 678 | 15 | 9 122 | 19 | 8 884 | 16 | 7 633 | 12 | 7 422 | 11 |
Gross incurred losses | 4 616 | 9 | 5 569 | 11 | 7 877 | 14 | 6 017 | 10 | 4 603 | 7 |
Net incurred losses | 3 128 | 6 | 4 140 | 8 | 4 285 | 7 | 3 684 | 6 | 3 978 | 6 |
Management expenses (1) | 4 696 | 9 | 5 930 | 12 | 6 031 | 11 | 5 606 | 9 | 4 934 | 7 |
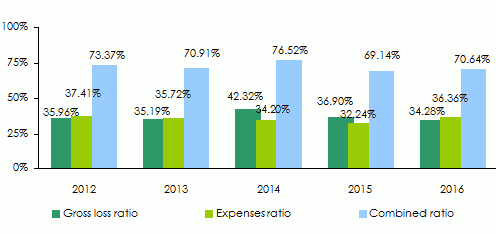
Gross loss ratio | 35.96% | 35.96% | 35.19% | 35.19% | 42.32% | 42.32% | 36.9% | 36.9% | 34.28% | 34.28% |
Management expenses ratio(2) | 37.41% | 37.41% | 35.72% | 35.72% | 34.2% | 34.2% | 32.24% | 32.24% | 36.36% | 36.36% |
Gross combined ratio | 73.37% | 73.37% | 70.91% | 70.91% | 76.52% | 76.52% | 69.14% | 69.14% | 70.64% | 70.64% |
Net underwriting result | 336 | 0,678 | 3 377 | 7 | 3 625 | 6 717 | 3 145 | 5 | 2 425 | 3 |
Net result | 1 208 | 2 | 1 153 | 2 | 808 | 1 | 748 | 1 | 203 | 0.326 |
expenses ratio = management expenses / gross written premiums
Assinco: evolution of premiums, losses and results (2012-2016)
In thousands USD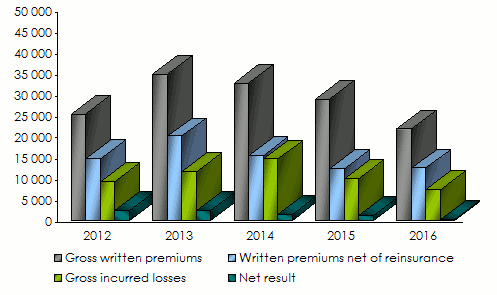
Assinco: Breakdown of turnover per class of business (2015-2016)
in millions
| 2012 | 2013 | 2014 | 2015 | 2016 | 2016 shares | ||||||
|---|---|---|---|---|---|---|---|---|---|---|---|
| FCFA | USD | FCFA | USD | FCFA | USD | FCFA | USD | FCFA | USD | ||
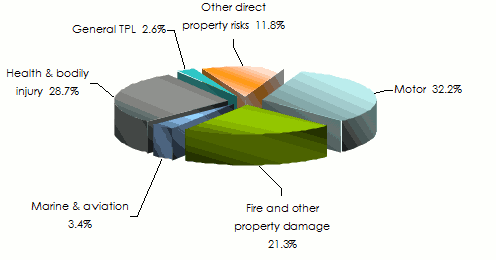
Health and bodily injury | 2 566 | 5 | 4 892 | 10 | 4 571 | 8 | 3 909 | 6 | 3 895 | 6 | 28.7% |
Motor | 5 397 | 10 | 5 470 | 11 | 4 298 | 7 | 3 850 | 6 | 4 363 | 7 | 32.2% |
Fire and other property damage | 1 841 | 3 | 3 061 | 6 | 4 422 | 8 | 5 245 | 8 | 2 886 | 4 | 21.3% |
General third party liability | 569 | 1 | 609 | 1 | 869 | 1 | 736 | 1 | 353 | 0.569 | 2.6% |
Marine & aviation | 1 252 | 2 | 1 222 | 2 | 1 069 | 1 | 791 | 1 | 468 | 0.754 | 3.4% |
Other direct property risks | 923 | 1 | 1 346 | 2 | 1 214 | 2 | 2 509 | 4 | 1 600 | 2 | 11.8% |
Acceptances | - | - | - | - | 1 191 | 2 | 346 | 0.577 | - | - | - |
Total | 12 551 | 25 | 16 602 | 34 | 17 637 | 32 | 17 389 | 28 | 13 568 | 21 | 100% |
Assinco: breakdown of turnover per class of business in 2016
Assinco: gross incurred losses per non life class of business(2015-2016)
in millions
| 2012 | 2013 | 2014 | 2015 | 2016 | ||||||
|---|---|---|---|---|---|---|---|---|---|---|
| FCFA | USD | FCFA | USD | FCFA | USD | FCFA | USD | FCFA | USD | |
Health and bodily injury | 1 244 | 2 | 2 797 | 5 | 3 313 | 6 | 2 674 | 4 | 2 791 | 4 |
Motor | 2 108 | 4 | 1 905 | 3 | 1 080 | 2 | 1 493 | 2 | 1 298 | 2 |
Fire and other property damage | 1 191 | 2 | 613 | 1 | 1 775 | 3 | 199 | 0.332 | 777 | 1 |
General third party liability | 241 | 0.488 | 214 | 0.450 | 1 014 | 1 | 911 | 1 | -686(1) | -1 (1) |
Marine & aviation | -55 | -0,112 | -27 | -0.58 | 227 | 0.422 | 369 | 0.616 | 70 | 0.113 |
Other direct property risks | -113 | -0.228 | 66 | 0.140 | 37 | 0.70 | 100 | 0.168 | 351 | 0.566 |
Acceptances | - | - | - | - | 428 | 0.794 | 268 | 0.447 | - | - |
Total | 4 616 | 9 | 5 569 | 11 | 7 877 | 14 | 6 017 | 10 | 4 603 | 7 |
Assinco: gross earned premiums per non life class of business(2015-2016)
in millions
| 2012 | 2013 | 2014 | 2015 | 2016 | ||||||
|---|---|---|---|---|---|---|---|---|---|---|
| FCFA | USD | FCFA | USD | FCFA | USD | FCFA | USD | FCFA | USD | |
Health and bodily injury | 2 669 | 5 | 4 751 | 9 | 4 733 | 8 | 3 946 | 6 | 3 774 | 6 |
Motor | 5 275 | 10 | 5 366 | 11 | 4 652 | 8 | 3 927 | 6 | 4 327 | 6 |
Fire and other property damage | 1 954 | 3 | 2 693 | 5 | 4 780 | 8 | 4 456 | 7 | 3 302 | 5 |
General third party liability | 453 | 0,916 | 580 | 1 | 916 | 1 | 845 | 1 | 337 | 0.542 |
Marine & aviation | 1 254 | 2 | 1 180 | 2 | 1 128 | 2 | 787 | 1 | 436 | 0.703 |
Other direct property risks | 1 229 | 2 | 1 252 | 2 | 1 288 | 2 | 1 979 | 3 | 1 249 | 2 |
Acceptances | - | - | - | - | 1 115 | 2 | 366 | 0,611 | - | - |
Total | 12 837 | 25 | 15 825 | 33 | 18 615 | 34 | 16 308 | 27 | 13 428 | 21 |
Assinco: gross loss ratios per non life class of business (2015-2016)
| 2012 | 2013 | 2014 | 2015 | 2016 | |
|---|---|---|---|---|---|
Health and bodily injury | 46.61% | 58.87% | 70.0% | 67.77% | 73.97% |
Motor | 39.96% | 35.5% | 23.22% | 38.02% | 30.0% |
Fire and other property damage | 60.93% | 22.77% | 37.13% | 4.47% | 23.54% |
General third party liability | 53.3% | 36.98% | 110.65% | 107.88% | -203.7% (1) |
Marine & aviation | -4.42% | -2.34% | 20.19% | 46.95% | 16.07% |
Other direct property risks dommages | -9.18% | 5.33% | 2.93% | 5.1% | 28.19% |
Acceptances | - | - | 38.41% | 73.16% | - |
Total | 35.96% | 35.19% | 42.32% | 36.9% | 34.28% |
Source: Assinco’s balance sheets
Exchange rate FCFA/USD as at 31/12 | 2012 | 2013 | 2014 | 2015 | 2016 |
0.00202 | 0.002098 | 0.00185 | 0.00167 | 0.001608 |
Read also : Assinco, 2017 results

Assinco
| Head office | BP 7812 Libreville, Gabon |
| Tel | 241 01 72 19 25/26/28 |
| Website |
