Insurance market results of the FANAF zone from 2006 to 2014
 This entity has been built around a hard core governed by the insurance code of the CIMA Zone (Benin, Burkina Faso, Cameroon, Republic of Central Africa, Congo Brazzaville, Côte d'Ivoire, Gabon, Guinea Bissau, Equatorial Guinea, Mali, Niger, Senegal, Chad and Togo).
In the analysis that will follow, Atlas Magazine insurance has processed the figures that relate only to the countries mentioned here above, to which Madagascar, Rwanda, Burundi and Guinea Conakry have been added. Because of the absence of data, Guinea Bissau and Equatorial Guinea shall not be part of the study.
Insurance in the FANAF zone: evolution of turnover per country
A By the end of 2014, the insurance premiums collected by the 16 countries under study amounted to 1037.9 billion FCFA (1.920 billion USD), an increase of 6.7% in comparison with 2013.
Expressed in US dollar , this turnover accounts for just 2.78% of the overall premiums of the continent which amount to 68.974 billion USD. Non life premiums represent 72% of the revenues. At the African and global levels, this class of business accounts respectively for 34% and 44% of the total premiums.
Côte d’Ivoire, alone, underwrites 24.4% of the premiums of the zone under study. It is followed by Cameroon (15.2%), Gabon (11.7%), and Senegal (9.9%). This ranking of the first four countries, in terms of premium volume, has remained unchanged since 2012, the year when Gabon overtook Senegal.
During the 2006-2014 period, the average annual growth of the premiums written in FCFA by all of the member countries in the FANAF Zone (excluding reinsurance acceptances) is of 9.1%. But in US dollar, this growth is limited to 7.5%. The three markets that achieved the highest average progression rates are Guinea Conakry with 18.5%, Congo Brazzaville with 15.5% and Rwanda with 14.2%. For the latter country, the 2014 growth rate was of 97.9%.
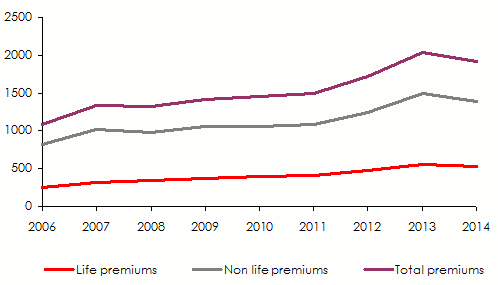
The FANAF market: evolution of life and non life premiums: 2006-2014
In millions USD
| Year | Life premiums | Evolution | Non life premiums | Evolution | Total premiums | Evolution |
|---|---|---|---|---|---|---|
2006 | 255 | 17% | 825 | 7.1% | 1 080 | 9.3% |
2007 | 324 | 27.1% | 1 012 | 22.7% | 1 336 | 23.7% |
2008 | 342 | 5.6% | 982 | -3% | 1 324 | -0.9% |
2009 | 365 | 6.7% | 1 056 | 7.5% | 1 421 | 7.3% |
2010 | 396 | 8.5% | 1 053 | -0.3% | 1 449 | 2% |
2011 | 414 | 4.5% | 1 079 | 2.5% | 1 493 | 3% |
2012 | 479 | 15.7% | 1 238 | 14.7% | 1 717 | 15% |
2013 | 549 | 14.6% | 1 494 | 20.7% | 2 043 | 19% |
2014 | 531 | -3.3% | 1 389 | -7% | 1 920 | -6% |
Moyenne | 9.6% | 6.7% | 7.5% |
Evolution of premiums of FANAF zone: 2006-2014
Evolution of premiums, losses and loadings* of FANAF zone: 2006-2014
In millions USD
| Year | Premiums | Evolution | Losses | Evolution | Loadings | Evolution |
|---|---|---|---|---|---|---|
2006 | 1 080 | 9.3% | 550 | 26.6% | 419 | 17.5% |
2007 | 1 336 | 23.7% | 625 | 13.6% | 483 | 15.3% |
2008 | 1 324 | -0.9% | 520 | -16.8% | 496 | 2.7% |
2009 | 1 421 | 7.3% | 638 | 22.7% | 539 | 8.7% |
2010 | 1 449 | 2% | 592 | -7.21% | 532 | -1.3% |
2011 | 1 493 | 3% | 587 | -0.8% | 558 | 4.9% |
2012 | 1 717 | 15% | 682 | 16.2% | 591 | 5.9% |
2013 | 2 043 | 19% | 894 | 31.1% | 665 | 12.5% |
2014 | 1 920 | -6% | 932 | 4.2% | 650 | -2.3% |
Average | 7.5% | 6.81% | 5.64% |
* Loadings = commissions + overhead expenses
FANAF zone: 2014 turnover per country (excluding reinsurance acceptances)
In millions USD
| Rank | Country | Turnover (excluding reinsurance acceptances) | Market shares |
|---|---|---|---|
1 | Côte d'Ivoire | 457.8 | 24.4% |
2 | Cameroon | 285.6 | 15.2% |
3 | Gabon | 219.8 | 11.7% |
4 | Senegal | 185.2 | 9.9% |
5 | Congo Brazzaville | 129.8 | 6.9% |
6 | Rwanda | 106.3 | 5.7% |
7 | Burkina Faso | 93.1 | 5% |
8 | Togo | 81.9 | 4.4% |
9 | Benin | 75 | 4% |
10 | Madagascar | 59.6 | 3.2% |
11 | Mali | 59.1 | 3.2% |
12 | Niger | 48.3 | 2.6% |
13 | Guinea Conakry | 32.8 | 1.7% |
14 | Chad | 25.2 | 1.3% |
15 | Burundi | 11.3 | 0.6% |
16 | Central African Republic | 4.4 | 0.2% |
Total | 1875.2 | 100% |
Ranking of the top ten companies in 2014 of the FANAF Zone
In millions USD
| Rank | Companies | Category | Country | Premiums 2013 (1) | Premiums 2014 | Evolution 2013-2014 | Combined ratio (2) |
|---|---|---|---|---|---|---|---|
1 | Saham Assurance | NL | Côte d'Ivoire | 70 934.24 | 73 337.53 | 3.39% | 76.9% |
2 | Assurances et Réassurances du Congo | NL | Congo Brazzaville | 72 394.73 | 69 083.37 | -4.57% | 31% |
3 | Omnium Gabonais d'Assurances et de Réassurances | NL | Gabon | 59 710.83 | 55 693.60 | -6.73% | 43.6% |
4 | SUNU Assurances Vie Côte d'Ivoire | L | Côte d'Ivoire | 43 838.46 | 45 613.30 | 4.05% | NA |
5 | NSIA Gabon | NL | Gabon | 39 194.20 | 39 283.24 | 0.23% | 74.4% |
6 | NSIA Vie Côte d'Ivoire | V | Côte d'Ivoire | 38 625.25 | 36 079.36 | -6.59% | NA |
7 | Assurances et Réassurances Omnibranches | NL | Madagascar | 24 748.61 | 35 759.98 | 44.49% | 38.1% |
8 | CHANAS Assurances | NL | Cameroon | 42 969.19 | 35 645.34 | -17.04% | 52.1% |
9 | NSIA Côte d'Ivoire | NL | Côte d'Ivoire | 35 153.06 | 35 556.26 | 1.15% | 104.6% |
10 | Société Africaine d’Assurances et de Réassurances | NL | Cameroon | 38 747.69 | 33 987.81 | -12.28% | 83.6% |
(1) Figures revised as at 31/12/2014
(2) Combined ratio = (incurred losses / earned premiums) + (loadings / written premiums)
L = life company NL = non life company
NA = not available
Exchange rate USD/FCFA as at 31/12 | 2006 | 2007 | 2008 | 2009 | 2010 | 2011 | 2012 | 2013 | 2014 |
477 | 436 | 471 | 475 | 514 | 528 | 506 | 476 | 540 |
Source: Reports of the Fédération des Sociétés d’Assurances de Droit National Africaines (FANAF)
