Insurance in the Gulf countries : market indicators in 2016
Insurance in the Gulf countries : Over 300% rise in premiums between 2006 and 2016
 Dubai view, United Arab Emirates Dubai view, United Arab Emirates |
The six countries combined, namely Saudi Arabia, United Arab Emirates, Bahrain, Qatar, Kuwait and Oman, reported in late December 2016 an overall turnover of 26 billion USD, against 6.4 billion USD in 2006. Premium increase exceeded 300% over a ten-year period. Over a shorter period of six years, that is, from 2011 to 2016, the average annual growth rate was set at 12%.
Despite the infatuation of past years, most of the countries in the Gulf Cooperation Council are currently facing a stagnation of their premium volume and a declining profitability. This context is prone to a restructuring of insurance operations.
Evolution of Gulf countries’ premiums: 2011-2016
In thousands USD| 2011 | 2012 | 2013 | 2014 | 2015 | 2016 | 2016 shares | |
|---|---|---|---|---|---|---|---|
United Arab Emirates | 6 514 030 | 7 153 572 | 8 033 919 | 9 131 596 | 10 063 235 | 10 237 000 | 39.3% |
Saudi Arabia | 4 967 110 | 5 653 034 | 6 730 232 | 8 124 367 | 9 731 658 | 9 830 703 | 37.8% |
Qatar | 1 197 000 | 1 339 000 | 1 994 000 | 2 677 000 | 2 813 000 | 2 935 000 | 11.3% |
Oman | 728 499 | 856 692 | 948 429 | 1 033 140 | 1 152 149 | 1 173 663 | 4.5% |
Kuwait | 819 000 | 904 000 | 946 000 | 1 060 000 | 1 048 000 | 1 116 000 | 4.3% |
Bahrain | 571 916 | 634 088 | 691 236 | 730 945 | 729 485 | 727 037 | 2.8% |
Total | 14 797 555 | 16 540 386 | 19 343 816 | 22 757 048 | 25 537 527 | 26 019 403 | 100% |
By late 2016, two countries, United Arab Emirates and Saudi Arabia, dominated the region accounting alone for 77.1% of the premiums volume.
United Arab Emirates: evolution of life and non life premiums: 2011-2016
In millions USD| Year | Non life | Evolution | Life | Evolution | Total | Evolution |
|---|---|---|---|---|---|---|
| 2016 | 7 789 000 | 4.1% | 2 448 000 | -5.2% | 10 237 000 | 1.7% |
| 2015 | 7 479 221 | 10.3% | 2 584 014 | 9.7% | 10 063 235 | 10.2% |
| 2014 | 6 777 312 | 10.7% | 2 354 284 | 22.9% | 9 131 596 | 13.6% |
| 2013 | 6 119 468 | 10.6% | 1 914 451 | 18% | 8 033 919 | 12.3% |
| 2012 | 5 531 213 | 5.6% | 1 622 359 | 5.6% | 7 153 572 | 9.8% |
| 2011 | 5 236 183 | - | 1 277 847 | - | 6 514 030 | - |
Saudi Arabia: evolution of premiums per class of business: 2011-2016
In millions USD| Year | Non life | Evolution | Health | Evolution | Protection & savings | Evolution | Total | Evolution |
|---|---|---|---|---|---|---|---|---|
| 2016 | 4 580 993 | 4.2% | 4 969 366 | -1.7% | 280 344 | 1.48% | 9 830 703 | 1.02% |
| 2015 | 4 397 858 | 19.1% | 5 057 551 | 20.7% | 276 249 | 14.65% | 9 731 658 | 19.8% |
| 2014 | 3 693 306 | 20.4% | 4 190 118 | 21.9% | 240 943 | 6.93% | 8 124 367 | 20.7% |
| 2013 | 3 066 324 | 27.6% | 3 438 581 | 14.1% | 225 328 | -5.06% | 6 730 232 | 19.1% |
| 2012 | 2 402 819 | 12.5% | 3 012 869 | 16.4% | 237 345 | -1.66% | 5 653 034 | 13.8% |
| 2011 | 2 136 729 | - | 2 589 027 | - | 241 354 | - | 4 967 110 | - |
Qatar : evolution of life and non life premiums: 2011-2016
In millions USD| Year | Non life | Evolution | Life | Evolution | Total | Evolution |
|---|---|---|---|---|---|---|
| 2016 | 2 888 000 | 5.3% | 47 000 | -34.7% | 2 935 000 | 4% |
| 2015 | 2 741 000 | 5% | 72 000 | 5.8% | 2 813 000 | 5% |
| 2014 | 2 609 000 | 35% | 68 000 | 9.7% | 2 677 000 | 34% |
| 2013 | 1 932 000 | 50.8% | 62 000 | 6.9% | 1 994 000 | 48.9% |
| 2012 | 1 281 000 | 12% | 58 000 | 7.4% | 1 339 000 | 11.9% |
| 2011 | 1 143 000 | - | 54 000 | - | 1 197 000 | - |
Oman : evolution of life and non life premiums: 2011-2016
In millions USD| Year | Non life | Evolution | Life | Evolution | Total | Evolution |
|---|---|---|---|---|---|---|
| 2016 | 997 395 | -1.6% | 176 268 | 27.7% | 1 173 663 | 1.8% |
| 2015 | 1 014 151 | 9.6% | 137 998 | 27% | 1 152 149 | 11.5% |
| 2014 | 924 620 | 7.4% | 108 520 | 72.8% | 1 033 140 | 8.9% |
| 2013 | 860 697 | 14.5% | 87 732 | -16.6% | 948 429 | 10.7% |
| 2012 | 751 451 | 31.8% | 105 241 | -33.5% | 856 692 | 17.6% |
| 2011 | 570 195 | - | 158 304 | - | 728 499 | - |
Kuwait : evolution of life and non life premiums: 2011-2016
In millions USD| Year | Non life | Evolution | Life | Evolution | Total | Evolution |
|---|---|---|---|---|---|---|
| 2016 | 933 000 | 6.7% | 183 000 | 5.2% | 1 116 000 | 6.5% |
| 2015 | 874 000 | 0.5% | 174 000 | -8.9% | 1 048 000 | -1.1% |
| 2014 | 869 000 | 13.7% | 191 000 | 4.9% | 1 060 000 | 12% |
| 2013 | 764 000 | 4.5% | 182 000 | 5.2% | 946 000 | 4.6% |
| 2012 | 731 000 | 9.7% | 173 000 | 13% | 904 000 | 10.4% |
| 2011 | 666 000 | - | 153 000 | - | 819 000 | - |
Bahrain : evolution of life and non life premiums: 2011-2016
In millions USD| Year | Non life | Evolution | Life | Evolution | Total | Evolution |
|---|---|---|---|---|---|---|
| 2016 | 589 082 | 1.1% | 137 955 | -6.2% | 727 037 | -0.3% |
| 2015 | 582 340 | 2.4% | 147 145 | -9.3% | 729 485 | -0.2% |
| 2014 | 568 614 | 8.6% | 162 331 | -3.3% | 730 945 | 5.7% |
| 2013 | 523 334 | 10.3% | 167 902 | 5.2% | 691 236 | 9% |
| 2012 | 474 515 | 9.8% | 159 573 | 14% | 634 088 | 10.8% |
| 2011 | 431 983 | - | 139 933 | - | 571 916 | - |
Read also:
Insurance penetration rate in the Gulf countries
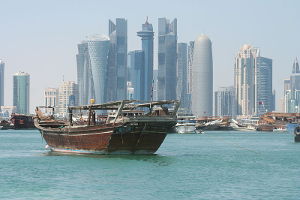
 Doha view, Qatar © Gregory Hawken Kramer, CC BY -SA 4.0 Doha view, Qatar © Gregory Hawken Kramer, CC BY -SA 4.0 |
Despite the sustained development witnessed in recent years, insurance penetration rate remains poor in most Gulf countries, with regional average set at 1.9%, well behind that of 6.28% at the global level.
Kuwait reported the lowest penetration rate with 0.89%. Life insurance is almost inexistent in Qatar where this business accounts for only 0.03% of the GDP. These markets are, nonetheless, endowed with huge growth potential.
Insurance penetration rate in 2016
| Total | Life | Non life | |
|---|---|---|---|
Saudi Arabia | 1.55% | 0.04% | 1.51% |
Bahrain | 2.28% | 0.43% | 1.85% |
United Arab Emirates | 2.87% | 0.69% | 2.18% |
Kuwait | 0.89% | 0.15% | 0.74% |
Qatar | 1.99% | 0.03% | 1.96% |
Oman | 1.83% | 0.22% | 1.61% |
Average CCG | 1.9% | 0.26% | 1.64% |
Average Asia | 5.59% | 3.74% | 1.85% |
Average Africa | 2.77% | 1.85% | 0.92% |
Average Europe | 6.72% | 3.99% | 2.73% |
Average World | 6.28% | 3.47% | 2.81% |
Insurance density in the Gulf countries
In 2016, insurance density for all countries in the region amounted to 625.4 USD, a level so close to the global average set at 638.3 USD.
Qatar (1288.3 USD) and the United Arab Emirates (1102 USD) report the highest per-capita premiums in the region. This indicator remains, nevertheless, poor in life insurance (77.8 USD per inhabitant) in comparison with the global average set at 353 USD.
Insurance density in 2016
In USD
| Total | Life | Non life | |
|---|---|---|---|
Saudi Arabia | 309.4 | 8.6 | 300.8 |
Bahrain | 510.2 | 96.8 | 413.4 |
United Arab Emirates | 1102 | 263.6 | 838.4 |
Kuwait | 280.4 | 46.1 | 234.3 |
Qatar | 1288.3 | 20.5 | 1267.8 |
Oman | 262.4 | 31.5 | 230.9 |
Average CCG | 625.4 | 77.8 | 547.6 |
Average Asia | 343.1 | 229.5 | 113.6 |
Average Africa | 50.4 | 33.7 | 16.7 |
Average Europe | 1620 | 961.9 | 658.1 |
Average World | 638.3 | 353 | 285.3 |