Mediterranean and Gulf Insurance and Reinsurance (Medgulf)

Since its beginning, the company has focused on the underwriting of health and motor risks. After a few years of operation, Medgulf stands along with Libano-Arabe, Arope, Union Nationale, Bankers and SNA among the leaders of the local market. In 1995, the company took the shape of a holding whose headquarter was in Bahrain.
Ever since, the group started rapid expansion. In partnership with Addison Bradley, a well-known broker on the London market, Medgulf has multiplied its establishments in the Middle East, especially in Saudi Arabia, its main market today, Jordan, United Arab Emirates, and London, of course.
From the position of first insurer of the Lebanese market in 2011, Medgulf had shifted to the third place in late 2015, just behind Allianz-SNA and Alico. The turnover, regressing for five years now, attained in 2015 a premium volume slightly above 115 million USD. After a heavy loss of 12 832 214 USD in 2014, accounted for by the health class of business, the insurer went back to profit-making in 2015.
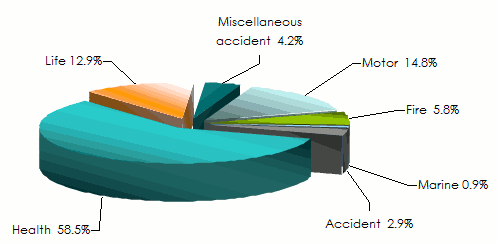
The company’s portfolio is made up at 73.3% of non life risks among which 58.5% and 14.8% for health and motor risks respectively.
 |  |
| Lutfi Fadel El-Zein | Fadi Cherkawi |
| Chairman of the board | Group CEO |
Megulf in 2015
| Share capital | 30 280 000 USD |
| Turnover | 115 111 657 USD |
| Total assets | 224 140 298 USD |
| Shareholder’s equity | 72 400 000 USD |
| Net result | 1 765 017 USD |
| Net non life loss ratio(1) | 81.6% |
| Non life expenses ratio(1) | 11.7% |
| Net non life combined ratio(1) | 93.3% |
| Network in Lebanon | 12 subsidiaries |
| Number of employees | 350 |
Shareholding
| A company wholly owned by Medgulf Holding SAL |
Management
| Chairman of the board | Lutfi Fadel El-Zein |
| Group CEO | Fadi Cherkawi |
Medgulf main technical highlights: 2011-2015
in USD
| 2011 | 2012 | 2013 | 2014 | 2015 | |
|---|---|---|---|---|---|
Gross written premiums | 124 532 257 | 119 753 018 | 135 022 896 | 129 376 764 | 115 111 657 |
Written premiums net of reinsurance | - | 106 870 212 | 123 095 274 | 120 998 729 | 103 500 768 |
Non life gross written premiums | 108 221 012 | 106 637 468 | 123 108 948 | 119 886 524 | 100 300 457 |
Net earned premiums | - | 107 775 144 | 122 099 874 | 119 433 874 | 101 060 832 |
Net non life earned premiums (1) | 106 861 452 | 96 729 453 | 111 902 287 | 111 836 592 | 88 353 115 |
Net incurred losses | - | 92 552 743 | 108 795 397 | 114 016 810 | 83 809 022 |
Net non life incurred losses (1) | 85 812 578 | 83 500 924 | 100 559 172 | 107 656 949 | 72 105 946 |
Management expenses (2) | 10 005 103 | 11 031 654 | 13 086 560 | 11 243 923 | 13 554 225 |
Non life management expenses (3) | 8 597 731 | 9 756 982 | 11 902 655 | 10 273 003 | 11 713 843 |
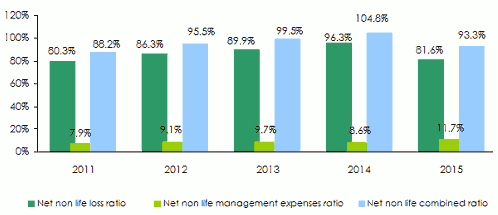
Net non life loss ratio(1) | 80.3% | 86.3% | 89.9% | 96.3% | 81.6% |
Non life management expenses ratio (1) (3) | 7.9% | 9.1% | 9.7% | 8.6% | 11.7% |
Net non life combined ratio (1) | 88.2% | 95.5% | 99.5% | 104.8% | 93.3% |
Net undewriting result | - | 1 195 072 | 6 815 064 | 14 531 659 | 3 373 921 |
Net result after tax | - | 2 305 759 | 3 622 989 | -12 832 214 | 1 765 017 |
(2) management expenses = managent expenses + paid commissions
(3)expenses ratio = management expenses / gross written premiums
Medgulf: evolution of net non life ratios(1): 2011-2015
Medgulf: breakdown of turnover per class of business (2011-2015)
in USD
| 2011 | 2012 | 2013 | 2014 | 2015 | 2015 shares | |
|---|---|---|---|---|---|---|
Fire | 4 996 262 | 5 848 531 | 5 839 340 | 5 600 534 | 6 622 682 | 5.8% |
Motor | 15 711 590 | 16 994 112 | 19 649 523 | 18 570 017 | 17 052 632 | 14.8% |
Marine | 752 992 | 1 095 858 | 1 064 187 | 879 185 | 1 080 005 | 0.9% |
Accident | 3 640 901 | 3 815 802 | 3 684 960 | 3 221 446 | 3 374 594 | 2.9% |
Health | 80 510 547 | 75 889 127 | 90 289 520 | 89 269 063 | 67 322 970 | 58.5% |
Miscellaneous accident (1) | 2 608 720 | 2 994 038 | 2 581 418 | 2 346 948 | 4 846 899 | 4.2% |
Total non life | 108 221 012 | 106 637 468 | 123 108 948 | 119 887 193 | 100 299 782 | 87.1% |
Life | 16 311 245 | 13 115 550 | 11 913 948 | 9 489 571 | 14 811 875 | 12.9% |
Grand total | 124 532 257 | 119 753 018 | 135 022 896 | 129 376 764 | 115 111 657 | 100% |
Medgulf: breakdown of 2015 turnover per class of business
Medgulf: net incurred losses per non life insurance: 2011-2015
in USD
| 2011 | 2012 | 2013 | 2014 | 2015 | |
|---|---|---|---|---|---|
Fire | 765 942 | 418 971 | 433 633 | 252 439 | 277 235 |
Motor | 10 543 583 | 11 448 322 | 13 718 046 | 12 522 190 | 10 318 922 |
Marine | 329 204 | 35 987 | 55 302 | 42 854 | 34 991 |
Accident | 2 268 834 | 2 422 031 | 2 803 420 | 2 347 618 | 2 386 103 |
Health | 68 084 634 | 68 831 681 | 83 218 182 | 92 280 924 | 58 735 422 |
Miscellaneous accident (1) | 3 820 381 | 343 932 | 330 589 | 210 924 | 353 273 |
Total non life | 85 812 578 | 83 500 924 | 100 559 172 | 107 656 949 | 72 105 946 |
Medgulf: net earned premiums per non life insurance: 2011-2015
in USD
| 2011 | 2012 | 2013 | 2014 | 2015 | |
|---|---|---|---|---|---|
Fire | 4 712 771 | 1 512 488 | 2 266 505 | 1 528 027 | 1 727 334 |
Motor | 16 694 849 | 17 077 492 | 17 613 300 | 17 647 308 | 18 262 506 |
Marine | 725 821 | 367 014 | 483 496 | 351 540 | 402 394 |
Accident | 3 499 325 | 3 408 437 | 3 723 046 | 3 125 693 | 3 146 480 |
Health | 78 569 272 | 72 781 573 | 86 205 005 | 88 184 311 | 63 707 480 |
Miscellaneous accident (1) | 2 659 414 | 1 582 449 | 1 610 935 | 999 713 | 1 106 921 |
Total non life | 106 861 452 | 96 729 453 | 111 902 287 | 111 836 592 | 88 353 115 |
Medgulf: net loss ratios per non life insurance: 2011-2015
| 2011 | 2012 | 2013 | 2014 | 2015 | |
|---|---|---|---|---|---|
Fire | 16.3% | 27.7% | 19.1% | 16.5% | 16% |
Motor | 63.2% | 67% | 77.9% | 71% | 56.5% |
Marine | 1452.6% | 9.8% | 11.4% | 12.2% | 8.7% |
Accident | 64.8% | 71.1% | 75.3% | 75.1% | 75.8% |
Health | 86.7% | 94.6% | 96.5% | 104.6% | 92.2% |
Miscellaneous accident (1) | 143.7% | 21.7% | 20.5% | 21.1% | 31.9% |
Total non life | 80.3% | 86.3% | 89.9% | 96.3% | 81.6% |
Source: Insurance Control Commission - Lebanon (ICC)
Exchange rate LBP/USD as at 31/12 | 2014 | 2015 |
0.0006696 | 0.0006729 |

Medgulf
| Head office | Ahmed Medgulf Bldg., Patriarche Howayek Str. P.O.Box 113 6320, Beirut, Lebanon |
| Tel | +961 1 985000 |
| Fax | +961 1 985005 |
| Website |
