Natural disasters in the world between 2001-2016: breakdown of risks per region
Natural disasters in 2016: causes and consequences of earthquakes and tsunamis
 |
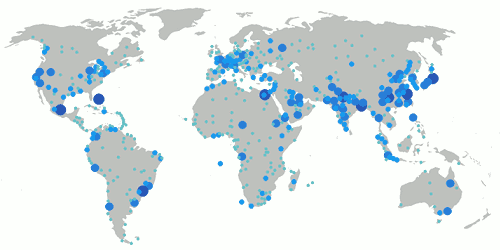
According to the researchers at the Paris Institute of Earth Physics (IPGP), every year, at the global level, nearly 150 earth tremors of magnitude above 6 on the Richter scale are reported. Two earthquakes above or equal to 7 occur every year in inhabited regions.
The risky zones are located in the countries neighboring the Pacific plate with the United States, Central and Latin America to the East. On the West of the same plate, we can mention Japan, China, Taiwan, the Philippines, Indonesia and New Zealand.
The convergence zone between Africa, Eurasia, India, the countries around the Mediterranean, Turkey, Central Asia, Iran, Pakistan, Afghanistan, Northern India and China constitutes the second area of large-scale seismic risks.
In Asia, Northern India, Pakistan and Indonesia are particularly exposed to major earthquake risk. The convergence of tectonic plates, the high population density and the dwellings non-compliant to anti-seismic standards account for the high level of exposure characterizing Asia. Major seismic events are also dreaded in the volcanic arcs of the Antilles and the Caribbean.
With the exception of the United States and Japan, the countries highly vulnerable to earthquakes, be it developed, emerging or poor, do not possess prevention devices nor do they have any insurance scheme that is sophisticated enough to counter this kind of natural disasters.
In 2016, the earthquakes that shook Taiwan, Japan, Equator, Italy and New Zealand caused 40 billion USD in economic losses for just 7.41 billion USD of insured losses.
The 2016 August earthquake in Italy cost 5.6 billion USD in damage. The losses borne by insurers are only 320 million USD. It is worth noting that in Italy, a country highly exposed to this kind of hazards, only 1% of the dwellings are insured against earthquakes.
The most onerous earthquake in 2016 remains that of Kumamoto (Japan). The earthquake has caused, alone, nearly 20 billion USD (1) in economic damage, 5 billion USD of which are insured losses.
The risk of tsunami
Tsunamis, or tidal waves, are directly linked to earthquakes. They are triggered immediately after the abrupt shift of the ocean floor. It is in Asia that most devastating tsunamis have been reported. The tusnami of 26 December 2004, alone, claimed the lives of approximately 230 000 people. In Fukushima (Japan), the earthquake and the tsunami that ensued caused more than 16 000 deaths on March 11, 2011.
Natural disasters: the prevention of earthquakes and tsunamis
 |
Short-term forecasts of earthquakes are impossible. On the medium and long-term basis, however, historical data and active fault surveillance may make it possible to evaluate the likelihood and the frequency of an earthquake occurrence in a given region.
Many countries like Japan and the United States of America are endowed with sophisticated tools designed to observe the movements of the earth’s crust. Developed warning systems make it possible today to detect an earthquake a few seconds before the arrival of the seismic wave. A momentary lapse that might be sufficient enough to shut down power installations in endangered areas.
(1) http://www.atlas-mag.net/en/article/natural-catastrophes-2016-toll
Natural disasters in the world: causes and consequences of floods
Floods stand among the most frequent and deadliest natural hazards in the world. According to the digital Water Atlas, these events are responsible for more than 60% of the natural catastrophes-related deaths, with Asia being the most exposed region to this risk. The summer monsoon is behind the disastrous floods of that region.
The monsoon affects mainly the tropical zones of Africa, the Indian Ocean and South Asia, triggering torrential rain that flood the cities and ravage crops.
Heavy rainfall triggered by cyclones are also behind floods, especially in south east and west of the United States and in Mexico.
Europe also stands among the most vulnerable regions. Indeed, the old continent has in recent years witnessed a particularly unstable weather forecast. Heavy rain associated with temperatures milder than usual have caused several floods. In December 2015, Scotland, the north of England and Wales sustained the heaviest rainfall that had occurred in these areas in the last 20 years. Late May 2016, torrential rain washed the center and north of France, triggering overflows of many rivers. The Seine's flooding of the same year got the river reaching its highest level ever since 1982.
The Mediterranean regions are also exposed to this kind of natural disasters (floods), with Southern Europe and North Africa being highly vulnerable zones.
In Latin America, devastating floods have been reported each year during the rainy season which extends from September to February, triggering landslides.
Snow also stands as a flood risk, especially in the countries of north Europe. Snow melting which generally occurs in spring increases considerably runoff water, a phenomenon that is likely to trigger floods.
Natural disasters: the most vulnerable regions to floods
Natural disasters in the world: causes and consequences of storms and cyclones
Formation and seasonality of cyclones, hurricanes and typhoons
 Source : http://www.lagons-plages.com/cyclones-tempetes-tropicales-caraibes.php
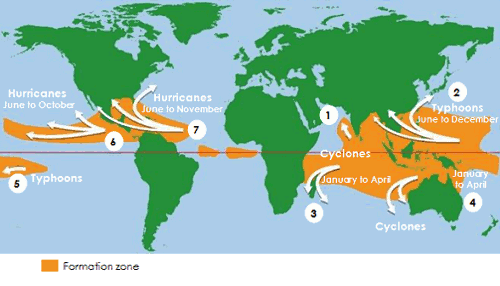
Cyclones come into shape above the hot waters of intertropical zone, taking the name of:
- hurricane in North Atlantic and Northeast Pacific,
- typhoon in East Asia,
- cyclone in other oceanic basins.
 |
Tropical cyclones are dreaded because of their destructive nature. They are classified among common natural risks. Each year, they cause damage worth several billions of dollars and a high number of deaths.
Some regions are harder hit than other by this kind of natural disasters. Southeast Asia, South Pacific, North America, Central America and the East coast of Africa are exposed to intense cyclonic activity.
According to Atlantic Oceanographic, there are seven major basins for the formation of tropical cyclones:
North Atlantic (Zone 7): This basin includes the Atlantic Ocean, the Caribbean Sea and the Gulf of Mexico. The United States, Mexico, Central America, the Caribbean and Canada may be affected by these cyclones. It is the most studied basin by scientists.
East North Pacific (Zone 6): It is the second most active zone in the world. The storms that develop in this basin may reach western Mexico, California and Central America.
South Pacific (Zone 5): It is the location that harbors thermic variations known under the name of El Nino which exerts substantial influence on the climate. It affects not only the isles in the region but also other regions on earth. In this region of the South Pacific, New Zealand stands among the isles that are hardest hit by typhoons.
South East of the Indian Ocean (Zone 4): Cyclones of this region generally affect Australia, New Caledonia and Oceania.
South West of the Indian Ocean (Zone 3): The climate disruptions affect Madagascar, Mozambique, the Reunion Island, Mauritius Island, the Comoros Islands, Tanzania and Kenya.
Pacifique nord-ouest (Zone 2): The zone is known for its cyclonic activity which affects mainly the Philippines, Taiwan, China and Japan.
Northwest Pacific (Zone 1): The cyclones formed in this basin are historically the deadliest. The countries affected by this area include India, Bangladesh, Sri Lanka and Thailand. The cyclones formed in this region may, on rare occasions, reach the Arab Peninsula.
Read also:
Seasonality of cyclones
Still, according to Atlantic Oceanography, the occurrence frequency of tropical cyclones generally reached its peak at the end of summer when the ocean water is warmer. Each basin has, nonetheless, its own seasonal characteristics:
- In the North Atlantic and North East Pacific: The hurricane season starts in early June and ends in late November
- The north-west Pacific generates tropical cyclones throughout the year, with hardly any of them in February but peaking at the beginning of September
- In the basin of the North Indian Ocean, cyclones are more frequent during the period between April and December, with peaks in May and in November
- In the Southern hemisphere, the formation of tropical cyclones starts toward the end of October and ends in May. Peaks occur in mid-February and early March
Natural disasters: consequences of cyclones
In terms of damage, tropical storms seem to have become more and more destructive. Since 1990, six of the ten most onerous hurricanes by global standard have taken place in the United States. This upsurge is mainly accounted for by global warming. The increase in real estate capital and high population density in exposed zones also contribute to the rising loss experience.
Natural disasters in the world: causes and consequences of drought
Drought risk per country in 2040
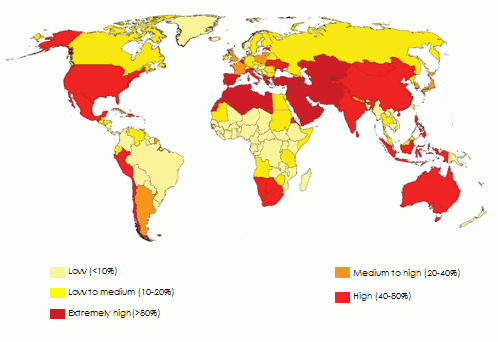
Climatologists refer to drought when there is absence of precipitation for a long period of time. With the exception of polar zones, almost all the countries may be affected by drought. Rain shortage coupled with high temperatures characterize the state of drought. The tropical and sub-tropical zones, characterized by arid or semi-arid climate that are, however the ones hardest hit by this phenomenon.
North Africa, the Middle East, south-east Europe, the United States, Mexico, Chile, Central Asia, India, China and Oceania remain the most vulnerable zones.
Other countries, namely Chile, Namibia and Botswana are also faced with the risk of drought because of the rise in temperatures and the decrease of rainfall.
Even if for the time being China, India and United States are less exposed than others to an extreme water scarcity, they are not safe from a catastrophe scenario. Entire regions of these countries may see their water resources dwindle down by 40% to 70% by 2040.
The Middle East, a region particularly exposed to droughts
According to a survey conducted by World Resources Institute (WRI)(1) , the Middle East will be faced in the course of the next 25 years with water scarcity issues. The shortage of hydric resources threatens 33 countries, 14 of which are located in the Middle East, a situation, which, on the long term, is likely to aggravate the instability of this region.
Bahrain, Kuwait, Qatar, United Arab Emirates and Palestine have maximal hydric stress index (2) , followed by Saudi Arabia, the Sultanate of Oman and Lebanon.
(1) An American research center dealing with environmental issues (2) This has been defined by water availability below 1 700 m3 per year and per capita.
Natural disasters: consequences of droughts
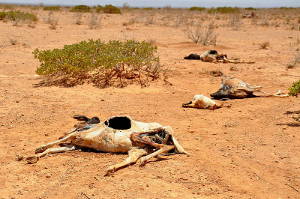 © Oxfam East Africa, CC BY 2.0 © Oxfam East Africa, CC BY 2.0 |
With climate change, droughts have become a recurrent phenomenon, a scourge with drastic repercussions on fauna and flora. They cause food insecurity, famine, migration of population along with socio-economic crises.
Droughts may also be behind forest fires that deject harmful gases, polluting the atmosphere and aggravating greenhouse gas effect.
Natural disasters in the world: causes and consequences of forest fires
Each year, 60 000 (1) forest fires are reported all over the world. Nearly 350 million hectares (1) are consumed by fire annually. Despite increased measures designed to prevent and counter forest fires, the areas destroyed by forest fires went twofold during the last thirty years.
The tropical Amazonian forest is particularly affected by this scourge. Approximately 8.5 million hectares, 3% of the surface of the earth’s lungs have been destroyed by the blaze in ten years.
Contrarily to pre-conceived ideas, bushfires do not affect only hot countries, they also occur in summer in sub-polar regions like Canada, Russia, Europe and the United States.
Canada, alone, is faced every year with approximately 8 000 fires, destroying in average more than 2.1 million hectares. The average number of fires varies between dry and wet years. Thunder is behind 50% of these disasters.
(1) «Les incendies du futur : la sécheresse chronique et l’augmentation des populations à ses lisières» Irstea (Institut national de recherche en sciences et technologies pour l’environnement et l’agriculture.
Natural disasters: consequences of forest fires
Forest fires trigger air pollution, global warming, disappearance of biodiversity and also the loss of human lives.
Unlike the already mentioned natural disasters, Man may be partially held responsible for this kind of catastrophe.
Natural disasters and growing urbanization
Climate warming, growing population density and rapid urbanization have aggravated the scale of natural disasters. Asia, which harbors 60% of the global population, stands among the most vulnerable zones to climate risks. The megacities of this continent have sustained several large-scale natural catastrophes in recent years. Exposure to risks is only increasing in the region.
Natural disasters in the world underscores the economic inequalities
The mapping of natural risks underscores the economic and social inequalities among countries. From a social standpoint, the consequences of natural disasters seem to be more related to the standard of development in the countries than to the level of exposure to hazards. It is in poor countries that the highest number of victims and dwellings destroyed by disasters is reported.
(1) Irstea (national research institute in sciences and technologies for the environment and agriculture)
Consequence of the natural disasters in the world: number and cost of the events (2001-2016)
Amounts in billion USD
| Year | Number of events | Economic damage | Insured damage | Insured damage share | Nomber of casualties |
|---|---|---|---|---|---|
| 2001 | 111 | >14.5 | 10 | 68.96% | 22 803 |
| 2002 | 130 | 42 | 11.4 | 27.14% | 10 729 |
| 2003 | 142 | 65 | 16 | 24.60% | 37 821 |
| 2004 | 116 | 120 | 46 | 38.30% | 292 800 |
| 2005 | 149 | 220 | 78 | 35.45% | 88 083 |
| 2006 | 136 | 43 | 11,8 | 27.40% | 22 400 |
| 2007 | 142 | 63.7 | 23.3 | 36.60% | 14 630 |
| 2008 | 137 | 258 | 44.7 | 17.30% | 234 900 |
| 2009 | 133 | 50 | 22 | 44% | 9 000 |
| 2010 | 167 | 194 | 39.8 | 20.51% | 297 127 |
| 2011 | 175 | 362 | 110 | 30.40% | 29 000 |
| 2012 | 168 | 178 | 71 | 39.90% | 8 984 |
| 2013 | 150 | 131 | 37 | 28.24% | 20 201 |
| 2014 | 191 | 101 | 27.7 | 27.72% | 7 066 |
| 2015 | 198 | 82 | 28 | 34.15% | 19 365 |
| 2016 | 160 | 150 | 42 | 28% | 6 884 |
Source: Atlas Magazine and Swiss Re
List of the most costly natural disasters for the insurance industry: 2001-2016
Amounts in million USD
| Date | Event | Country | Number of casualties | Economic damage(1) | Insured damage(2) |
|---|---|---|---|---|---|
08/2005 | Hurricane Katrina | United States, Gulf of Mexico | 1 836 | 135 000 | 80 699 |
03/2011 | Earthquake causing a tsunami | Japan | 18 451 | 210 000 | 37 344 |
10/2012 | Hurricane Sandy | United States, The Caribbean, Canada | 237 | 70 000 | 30 141 |
09/2008 | Hurricane Ike | United States, The Caribbean, Gulf of Mexico | 193 | 40 000 | 22 577 |
02/2011 | Christchurch earthquake | New Zealand | 185 | 15 000 | 17 072 |
09/2004 | Hurricane Ivan | United States, The Caribbean, Venezuela | 119 | 22 000 | 16 417 |
07/2011 | Heavy monsoon rains Extreme floods | Thailand | 815 | 30 000 | 16 005 |
10/2005 | Hurricane Wilma | United States, Mexico, The Caribbean | 53 | 20 000 | 15 447 |
09/2005 | Hurricane Rita | United States, Gulf of Mexico | 34 | 15 000 | 13 199 |
07/2012 | Drought in the Corn Belt | United States | 123 | 15 000 | 11 498 |
08/2004 | Hurricane Charley | United States, The Caribbean, Gulf of Mexico | 36 | 16 000 | 10 033 |
02/2010 | Earthquake causing a tsunami | Chile | 562 | 30 000 | 8 804 |
04/2011 | Series of extreme tornadoes | United States | 321 | 11 000 | 7 789 |
05/2011 | Series of extreme tornadoes | United States | 177 | 9 000 | 7 522 |
01/2007 | Winter storm Kyrill, Floods | North Europe | 54 | 10 000 | 7 057 |
08/2004 | Hurricane Frances | United States, Bahamas | 50 | 10 000 | 6 305 |
08/2011 | Hurricane Irene, Floods | United States, Canada, The Caribbean | 51 | 8 000 | 6 062 |
09/2010 | Canterbury earthquake | New Zeland | – | 5 080 | 5 502 |
04/2016 | Series of earthquakes | Japan - Kumamoto | 137 | 20 000 | 5000 |
09/2004 | Hurricane Jeanne | United States, The Caribbean | 3 034 | 8 000 | 4 895 |
06/2001 | Storm Allison | United States | 43 | 5 000 | 4 890 |
09/2004 | Typhoon Songda | Japan, South Korea | 45 | 7 170 | 4 555 |
05/2013 | Floods | Central Europe | 25 | 16 500 | 4 259 |
05/2003 | Thunderstorm, tornadoes | United States | 51 | - | 4 180 |
09/2016 | Hurricane Matthew | The Caribbean | 734 | 8 000 | 4 000 |
07/2013 | Snowstorm | Germany, France | – | 4 820 | 3 954 |
01/2009 | Tempête hivernale Klaus | France, Spain | 25 | 7 740 | 3 505 |
(1) Economic damage at the date of the event’s occurrence
(2) Insured damge indexed on the basis of 2016 Source: Swiss Re, Sigma 2017
Read our articles on:
