NSIA Assurances, insurance activity in figures
 The premiums' volume of the 16 subsidiaries under study amounted to 125.275 billion FCFA (232.1 million USD), far ahead the figure reported by SAHAM 108.984 billion FCFA (202 million USD), second in the ranking. NSIA’s 16 life and non life companies, alone, accounted for 14% of the turnover reported by all 140 companies operating in the FANAF zone, mentioned in the Atlas survey.
Life and non life premiums of the 5 largest groups: 2013-2014
in millions USD 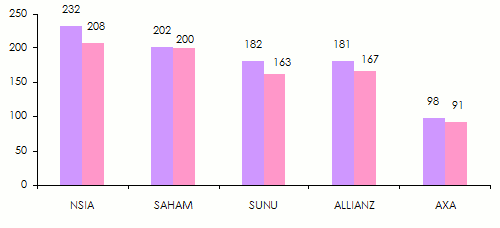 Source: Special FANAF figures 2014-Atlas Magazine (1) Federation of Africain insurance companies (FANAF). Regional organsiation gathering 29 African countries and 194 insurance and reinsurance companies
(2) www.atlas-mag.net/en/article/fanaf-2014-special-figures
(3)Figures for the 16 subsidiaires of the group only
NSIA Assurances subsidiaries
It is NSIA Assurances Gabon which reported in 2014 the highest turnover, followed by the two life and non life Ivorian subsidiaries.
It is worth noting that the first five companies of the group posted approximately 60% of the insurance turnover and 94% in net results of this class of business.
in USD
| Life and non life insurance subsidiaries | Category | Country | Turnover in 2014 | Technical results | Net results | ||
|---|---|---|---|---|---|---|---|
| Amount | Ranking | Amount | Ranking | ||||
NSIA Assurances, Gabon | NL | Gabon | 41 043 950 | 2 753 558 | 1 | 3 728 236 | 2 |
NSIA Assurances Life Côte d’Ivoire | V | Côte d'Ivoire | 36 101 999 | 2 054 977 | 3 | 3 342 812 | 3 |
NSIA Assurances, Côte d’Ivoire | NL | Côte d'Ivoire | 35 577 600 | 2 084 625 | 2 | 526 252 | 8 |
NSIA Assurances, Nigéria | NL | Nigeria | 29 905 567 | 1 387 897 | 4 | 6 024 103 | 1 |
NSIA Assurances, Congo | NL | Congo | 22 773 370 | 1 126 624 | 6 | 1 185 920 | 4 |
NSIA Assurances, Sénégal | NL | Senegal | 17 147 662 | 1 221 127 | 5 | 837 556 | 7 |
NSIA Assurances, Bénin | NL | Benin | 15 791 266 | 129 710 | 9 | 972 825 | 6 |
NSIA Assurances, Togo | NL | Togo | 14 042 034 | -548 488 | 16 | 987 649 | 5 |
NSIA Assurances, Cameroun | NL | Cameroon | 12 011 146 | -272 391 | 13 | -353 923 | 16 |
NSIA Assurances, Guinée | NL | Guinea | 9 496 625 | 55 590 | 10 | 35 207 | 14 |
NSIA Assurances Life, Togo | L | Togo | 7 967 900 | -442 867 | 15 | 68 561 | 13 |
NSIA Assurances Life, Mali | L | Mali | 7 621 389 | -392 836 | 14 | -694 875 | 18 |
NSIA Assurances Life, Sénégal | L | Senegal | 7 558 387 | -648 550 | 17 | 426 190 | 10 |
NSIA Assurances Life, Bénin | L | Benin | 4 764 063 | -114 886 | 11 | 502 163 | 9 |
NSIA Assurances Life, Gabon | L | Gabon | 4 052 511 | -728 229 | 19 | -607 784 | 17 |
NSIA Assurances, Mali | NL | Mali | 3 843 122 | -231 625 | 12 | -264 979 | 15 |
NSIA Assurances Life, Congo | L | Congo | 3 189 013 | 583 695 | 7 | 331 687 | 11 |
NSIA Assurances, Ghana | NL | Ghana | 1 693 642 | -1 447 193 | 20 | -1 536 137 | 19 |
NSIA Assurances, Guinée Bissau | NL | Guinea Bissau | 1 545 402 | 268 685 | 8 | 311 304 | 12 |
NSIA Assurances Life, Cameroun | V | Cameroon | 387 277 | -661 521 | 18 | NA | NA |
Total | 276 513 925 | 6 177 902 | 15 822 767 | ||||
NL: Non life insurance company
L: Life insurance company
NA: Not available
The activity of NSIA Assurances subsidiaries
The activity of insurance subsidiaries of the NSIA group has been examined through four aspects:
- The turnover reported in 2014,
- The subsidiary’s contribution in its own life and non life activity,
- The subsidiary’s contribution in the combined turnover of life and non life insurance,
- The subsidiary’s contribution in the group’s total turnover, all classes of business included.
Figures at 31.12.2014 in USD
| Non life insurance activity | Turnover | % in the non life activity | % in the combined life and non life activities | % in the overall turnover of NSIA | |
|---|---|---|---|---|---|
| 1 | NSIA Assurances, Gabon | 41 043 950 | 20% | 14.84% | 11.32% |
| 2 | NSIA Assurances, Côte d’Ivoire | 35 577 600 | 17.4% | 12.87% | 9.81% |
| 3 | NSIA Assurances, Nigéria | 29 905 567 | 14.6% | 10.82% | 8.25% |
| 4 | NSIA Assurances, Congo | 22 773 370 | 11% | 8.24% | 6.28% |
| 5 | NSIA Assurances, Sénégal | 17 147 662 | 8.4% | 6.20% | 4.73% |
| 6 | NSIA Assurances, Bénin | 15 791 266 | 7.7% | 5.71% | 4.36% |
| 7 | NSIA Assurances, Togo | 14 042 034 | 6.9% | 5.08% | 3.87% |
| 8 | NSIA Assurances, Cameroun | 12 011 146 | 5.9% | 4.34% | 3.31% |
| 9 | NSIA Assurances, Guinée | 9 496 625 | 4.6% | 3.43% | 2.62% |
| 10 | NSIA Assurances, Mali | 3 843 122 | 1.9% | 1.39% | 1.06% |
| 11 | NSIA Assurances, Ghana | 1 693 642 | 0.8% | 0.61% | 0.47% |
| 12 | NSIA Assurances, Guinée Bissau | 1 545 402 | 0.8% | 0.56% | 0.43% |
| Total non life insurance subsidiaries | 204 871 386 | 100% | 74.09% | 56.50% | |
| 13 | NSIA Assurances Life, Côte d’Ivoire | 36 101 999 | 50.4% | 13.06% | 9.96% |
| 14 | NSIA Assurances Life, Togo | 7 967 900 | 11.1% | 2.88% | 2.20% |
| 15 | NSIA Assurances Life, Mali | 7 621 389 | 10.6% | 2.76% | 2.10% |
| 16 | NSIA Assurances Life, Sénégal | 7 558 387 | 10.6% | 2.73% | 2.08% |
| 17 | NSIA Assurances Life, Bénin | 4 764 063 | 6.6% | 1.72% | 1.31% |
| 18 | NSIA Assurances Life, Gabon | 4 052 511 | 5.7% | 1.47% | 1.12% |
| 19 | NSIA Assurances Life, Congo | 3 189 013 | 4.5% | 1.15% | 0.88% |
| 20 | NSIA Assurances Life, Cameroun | 387 277 | 0.5% | 0.14% | 0.11% |
| Total life insurance subsidiaries | 71 642 539 | 100% | 25.91% | 19.76% | |
Total life and non life insurance subsidiaries | 276 513 925 | 76.26% | |||
NSIA Assurances market share per country
It is in Guinea that the market share of NSIA is the highest with 29.1%. Togo and Benin come second and third with 26.9% and 26.5% respectively. NSIA’s poor impact on the Cameroonian market (4.3%) is worth noting. In the life class of business, NSIA Mali, alone, accounts for 53.4% of the market share.
Figures as at 31.12.2014 in USD
Country | Category | Total market premiums | Premiums achieved by NSIA | NSIA market share |
|---|---|---|---|---|
Benin | Non life | 55 034 100 | 15 791 266 | 28.7% |
| Life | 22 482 449 | 4 764 063 | 21.2% | |
| Total | 77 516 549 | 20 555 329 | 26.5% | |
Cameroon | Non life | 204 756 500 | 12 011 146 | 5.9% |
| Life | 80 976 100 | 387 277 | 0.5% | |
| Total | 285 732 600 | 12 398 423 | 4.3% | |
Congo Brazzaville | Non life | 120 815 600 | 22 773 370 | 18.8% |
| Life | 9 079 700 | 3 189 013 | 35% | |
| Total | 129 895 300 | 25 962 383 | 20.0% | |
Côte d'Ivoire | Non life | 253 305 100 | 35 577 600 | 14.0% |
| Life | 204 756 500 | 36 101 999 | 17.6% | |
| Total | 458 061 600 | 71 679 599 | 15.6% | |
Gabon | Non life | 187 153 000 | 41 043 950 | 21.9% |
| Life | 32 798 100 | 4 052 511 | 12.4% | |
| Total | 219 951 100 | 45 096 461 | 20.5% | |
Guinea | Non life | 27 053 800 | 9 496 625 | 35.1% |
| Life | 5 744 300 | - | - | |
| Total | 32 798 100 | 9 496 625 | 29.1% | |
Mali | Non life | 44 842 600 | 3 843 122 | 8.6% |
| Life | 14 268 100 | 7 621 389 | 53.4% | |
| Total | 59 110 700 | 11 464 511 | 19.4% | |
Senegal | Non life | 136 566 100 | 17 147 662 | 12.6% |
| Life | 48 733 900 | 7 558 387 | 15.5% | |
| Total | 185 300 000 | 24 706 049 | 13.3% | |
Togo | Non life | 45 398 500 | 14 042 034 | 30.9% |
| Life | 36 504 100 | 7 967 900 | 21.8% | |
| Total | 81 902 600 | 22 009 934 | 26.9% | |
Total of markets under study | 1 530 268 549 | 243 369 314 | 15.9% | |
Contribution of each market in NSIA’s insurance turnover
In terms of premiums, two countries are performing well: Côte d’Ivoire which contributes with 25.92% in the group’s insurance turnover and Gabon whose contribution amounts to 16.32%.
With 6024 103 USD, Nigeria is reporting 38% of the total net result.
in USD
| Country | NSIA’s life and non life turnover | Share in the insurance turnover of NSIA | NSIA’s net resullt (Life and non life) | % in the net result of NSIA | |
|---|---|---|---|---|---|
| 1 | Benin | 20 555 329 | 7.43% | 1 474 988 | 9.32% |
| 2 | Cameroon | 12 398 423 | 4.48% | -353 923 | -2.24% |
| 3 | Congo | 25 962 383 | 9.39% | 1 517 607 | 9.59% |
| 4 | Côte d'Ivoire | 71 679 599 | 25.92% | 3 869 064 | 24.45% |
| 5 | Gabon | 45 096 461 | 16.32% | 3 120 452 | 19.72% |
| 6 | Guinea | 9 496 625 | 3.43% | 35 207 | 0.22% |
| 7 | Mali | 11 464 511 | 4.15% | -959 854 | -6.07% |
| 8 | Senegal | 24 706 049 | 8.93% | 1 263 746 | 8% |
| 9 | Togo | 22 009 934 | 7.96% | 1 056 210 | 6.68% |
| 10 | Ghana | 1 693 642 | 0.61% | -1 536 137 | -9.71% |
| 11 | Guinea Bissau | 1 545 402 | 0.56% | 311 304 | 1.97% |
| 12 | Nigeria | 29 905 567 | 10.82% | 6 024 103 | 38.07% |
| Group total | 276 513 925 | 100% | 15 822 767 | 100% | |
Main technical highlights of NSIA group: 2010-2014
in USD
| 2010 | 2011 | 2012 | 2013 | 2014 | |
|---|---|---|---|---|---|
Gross written premiums | 190 759 744 | 231 409 792 | 239 344 374 | 281 564 188 | 276 513 925 |
Written premiums net of reinsurance | 151 825 060 | 184 068 841 | 188 933 982 | 216 081 412 | 214 657 079 |
Gross incurred losses (1) | 69 833 754 | 93 911 689 | 102 716 625 | 123 777 804 | 140 040 475 |
Incurred losses net of reinsurance | 61 730 094 | 76 134 449 | 83 992 419 | 100 139 638 | 51 450 398 |
Management expenses (2) | 70 398 742 | 85 549 951 | 90 330 060 | 103 404 126 | 96 040 990 |
Loss ratios(3) | 37.59% | 40.69% | 43.06% | 44.5% | 50.92% |
Expenses ratios | 36.9% | 36.96% | 37.74% | 36.72% | 34.78% |
Combined ratios | 74.49% | 77.65% | 80.80% | 81.22% | 85.70% |
Technical results | 6 004 544 | 8 048 022 | 6 493 104 | 467 854 | 6 843 129 |
Financial income | 7 202 566 | 12 116 275 | 15 152 595 | 17 237 168 | 12 935 793 |
Pre-tax results | 15 139 204 | 22 949 532 | 23 808 048 | 20 684 182 | 25 045 148 |
Net results (after tax) | 11 477 092 | 15 438 447 | 16 594 161 | 14 472 004 | 15 824 620 |
(1) Paid losses + outstanding losses
(2) Overhead expenses + acquisition costs
(3) Incurred losses /earned premiums
The group turnover per class of business: 2010-2014
in USD
| Class of business | 2010 | 2011 | 2012 | 2013 | 2014 | % in 2014 |
|---|---|---|---|---|---|---|
Motor | 41 365 782 | 46 236 912 | 46 774 173 | 53 924 894 | 52 135 606 | 18.85% |
Property damage & miscellaneous accident | 9 839 864 | 14 726 553 | 13 985 613 | 16 926 664 | 20 795 976 | 7.52% |
Marine | 9 736 764 | 13 827 636 | 15 790 599 | 19 091 800 | 17 563 479 | 6.35% |
Health | 37 202 604 | 44 680 398 | 46 632 843 | 53 977 344 | 50 107 409 | 18.12% |
Personal accident | 5 532 346 | 4 265 331 | 4 690 137 | 4 577 836 | 3 817 018 | 1.38% |
Third party liability | 8 349 038 | 8 544 739 | 7 825 644 | 10 189 986 | 7 570 945 | 2.74% |
Fire | 19 007 516 | 25 493 447 | 23 038 809 | 29 875 520 | 24 624 128 | 8.91% |
Energy | ND | 1 321 227 | 1 469 832 | 1 485 384 | 1 423 263 | 0.51% |
Engineering | ND | 657 597 | 1 126 602 | 1 380 484 | 1 317 493 | 0.48% |
Reinsurance acceptances | 12 202 916 | 10 135 440 | 11 835 378 | 14 965 034 | 15 236 527 | 5.51% |
Life insurance | 47 527 038 | 61 522 523 | 66 096 003 | 75 171 340 | 81 922 080 | 29.63% |
Total | 190 761 806 | 231 413 814 | 239 269 671 | 281 566 286 | 276 513 925 | 100% |
Exchange rate FCFA/USD au 31/12 | 2010 | 2011 | 2012 | 2013 | 2014 |
0.002062 | 0.002011 | 0.002019 | 0.002098 | 0.001853 |
Source: NSIA
Technical indicators of NSIA Assurances' subsidiaries (2010-2014)
Atlas Magazine provides you with a presentation sheet for every life and non life insurance subsidiary of NSIA group.
To directly access the sheet in question, please click on the name of the subsidiary mentioned in the list below. You will find its main technical highlights for the 2010-2014 period
Non life insurance companies
- NSIA Assurances, Gabon
- NSIA Assurances, Côte d’Ivoire
- NSIA Assurances, Nigéria
- NSIA Assurances, Congo
- NSIA Assurances, Sénégal
- NSIA Assurances, Bénin
- NSIA Assurances, Togo
- NSIA Assurances, Cameroun
- NSIA Assurances, Guinée
- NSIA Assurances, Mali
- NSIA Assurances, Ghana
- NSIA Assurances, Guinée Bissau
Life insurance companies