The 2018 reinsurance renewal
 |
The year 2017 has been characterized by a high number of major claims which occurred after an already difficult 2016. Following the natural catastrophes that hit the Caribbean, Mexico and Southeast United States in the course of the third quarter, the market is scrutinizing the response of reinsurers. Will the latter have the necessary resources to toughen the terms of treaties' renewal? Is the capacity provided to ceding companies in adequacy with their needs? These are the questions that this focus tries to answer.
Reinsurance renewal 2018: key figures
Evolution of reinsurance turnover
After an average annual increase of 5% between 2008 and 2014, that is, six years in a row, the reinsurance market sustained a premium reduction of 2% in 2015 before shrinking once again by 4% in 2016. The non life class of business is behind this slowdown.
Evolution of global reinsurance turnover: 2005-2016
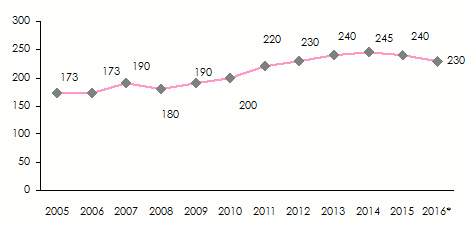 * Estimates Source: Standard & Poor’s
According to the figures provided by A.M. Best, Swiss Re, which reported 35.6 billion USD of premiums in 2016, snatched the world’s number one ranking from Munich Re which comes in second position with 33.2 billion USD, followed by Hannover Re (17.2 billion USD), SCOR (14.6 billion USD) and Berkshire Hathaway (12.7 billion USD).
The combined market share of the first five reinsurers has more than doubled between 1990 and 2016, rising from 23% to 50% during the interval in question.
Evolution of market shares between 1990 and 2016 (in %)
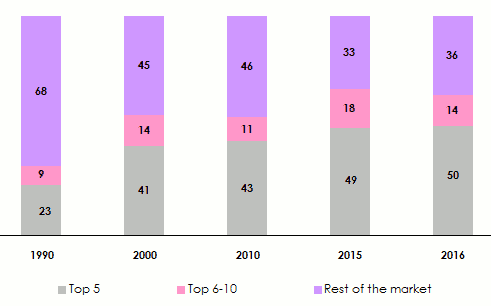 Source: SCOR’s estimates
 With 68.8 billion USD in 2016, the first two groups of reinsurers, alone, account for 30% of global life and non life premiums. During the same year, the world’s top ten reinsurers accounted for 67% of the premium volumes, that is, 154.6 billion USD. These figures and percentages confirm the growing shortage in risk diversification. This concentration is inconsistent with the core principle of reinsurance whose main driver is risk mutualization and atomization. This traditional role of geographical distribution of risks is now being questioned. Reinsurers’ panel is decreases and hence, increases counterparty risks.
Evolution of technical results
The year 2016 reported a high level of natural catastrophes, close to the historical average. The increase of this kind of losses in the previous year nears 40%.
Major natural catastrophes in 2016
in billion USD| Date | Country | Event | Number of victims | Insured losses (1) |
|---|---|---|---|---|
April 2016 | Japan | Earthquake | 137 | 4.9 |
October 2016 | United States, Caribbean | Hurricane Matthew | 734 | 4 |
August 2016 | United States, Louisiana | Storm and floods | 13 | 3.1 |
April 2016 | Canada | Hail storm | - | 3 |
May 2016 | Europe | Storm and floods | 17 | 2.9 |
May 2016 | Canada | Fort McMurray forest fires | - | 2.8 |
November 2016 | New Zeland | Earthquake | 2 | 1,7 à 2,4 |
Evolution of combined ratio: 1992-2016
After a challenging year in terms of catastrophes, the 2016 reinsurance year exhibited a combined ratio close to 100%. This median estimate is based on a bracket between 97% and 102%. This 100% rate is 7 points above the one reported in average during the 2007- 2015 period (93%). The decade comprised between 1997 and 2006 had also been marked by a high combined ratio, with the latter attaining an average of 106%.
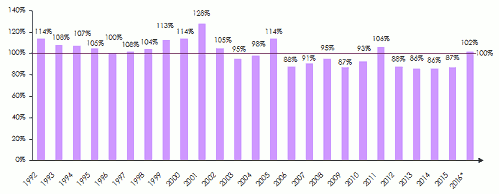 *Estimates Source: S&P Global Reinsurance Highlights
 In 2017, the outlook remains negative. Indeed, the exceptional loss experience reported during the third quarter of 2017 has been coupled with a regulatory change in Great Britain. The entry into force of the new claim reserving system of bodily injuries' claims is poised to compound the misery of insurers by 3 to 4 billion GBP (3.9 to 5.1 billion USD). The combined ratio for the current year will most likely be higher than that of 2016.
Evolution of the top 25 reinsurers’ combined ratios: 2015-2016 (1)
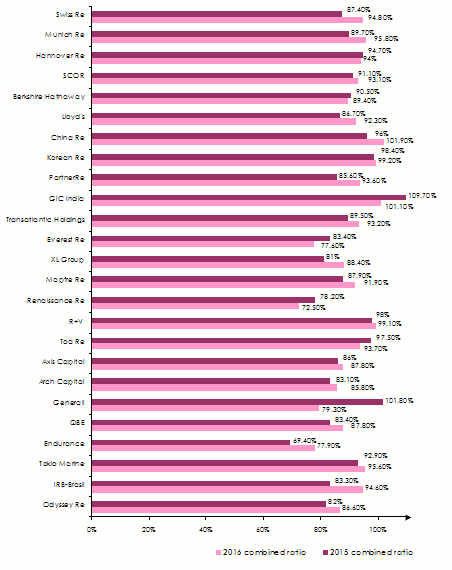 (1) Ranking per 2016 turnover
 Reinsurers’ profitability
The fierce competition among non life reinsurers has since 2003 triggered a decrease of profitability for the market’s major players. This competition is accounted for by steadily-rising alternative reinsurance capacity.
Another challenge hindering reinsurers is the lingering low interest rates which has considerably reduced the return of their investments.
According to rating agencies, both factors stand as a serious obstacle hindering the search for return that exceeds capital costs. In the first quarter of 2017, Standard & Poor’s noted that this return was only 1.2% above the sector’s capital cost.
In 2016, return on capital was set at 8.6% while its cost reached 6.5% for the same year. The current year is poised to undergo a notable decline of capital return due to tariff decreases that have dragged on throughout the year.
 |
Reinsurers have so far managed to come to grips with declining profitability thanks to a reserve release policy. It is because of the level of natural catastrophes' losses which has not been excessive, except for 2011, that reinsurers managed to counter-balance the results under pressure by release of reserves. A similar policy will be hard to pursue in order to conceal the losses in view of the loss experience peak that occurred in the summer of 2017.
As of 2006, the amount of reserves released by major non life reinsurers has grown steadily until 2011, the year hardest hit by natural catastrophes. These amounts have stabilized ever since around 7 billion USD per year.
Reserves released by the top 20 non life reinsurers (1)
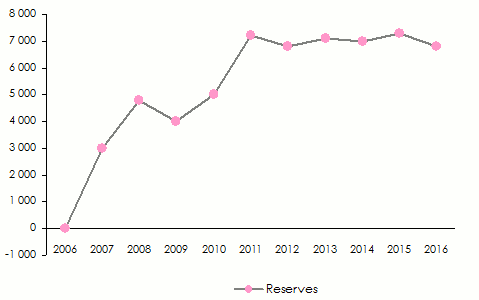 (1)Including direct non life insurance Source: Standard & Poor’s
 A 5-year average ROE, excluding loss reserve development
The diagram here below establishes the link between average profitability of shareholders’ equities of major reinsurers for five years and their policy of reserve release over the same period. It determines the massive use of this accounting process which is designed to inflate the ROE. This seems to be particularly the case of Partner Re or Endurance whereas groups such as Everest, SCOR, Hamilton Re, Maiden Holdings and Greenlight hardly make any recourse to this process.
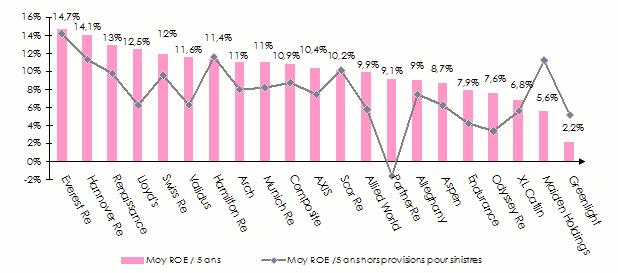
It is undoubtedly true that reinsurers whose reserve policy is conservative will be better positioned to contain the effects of claims emanating from natural catastrophes events having occurred in 2017. The same rationale shall also apply in order to reduce actuarial adjustment impact for bodily injuries' claims in Great Britain.
Reinsurance renewal 2018: the market’s overall capacity
 |
By the end of 2016, reinsurance capacity was estimated at approximately 595 billion USD by Aon Benfield and at 420 billion USD by Guy Carpenter and AM Best. These sums include alternative capital whose trace in non life reinsurance is undeniable. While traditional capacities have remarkably increased, the growth of alternative reinsurance has been even more notable as it has almost gone twofold since 1998.
Constantly growing, alternative capital accounted still according to Guy Carpenter and AM Best, for nearly 75 billion USD by the end of 2016, with a new record amount expected to be attained in 2017. For the record, Aon Benfield has estimated this amount at 86 billion USD by the end of March of the ongoing year for a global capacity of 605 billion USD. Risk-backed securities and catastrophe bonds account for about 85% of the sums at stake.
For several years, the relative leniency of natural catastrophes up to June 30, 2017, has enabled holders of this kind of assets to obtain attractive returns.
Estimate for total reinsurance capacity
in billions USD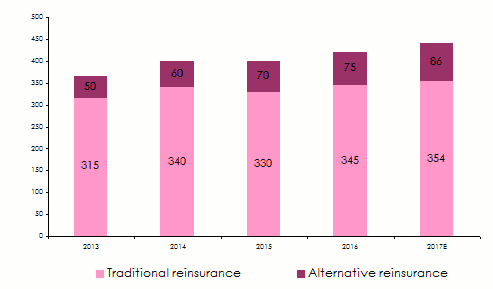 Source : A.M. Best and Guy Carpenter
 Alternative capital composition as of 31 March 2017 (86 billion USD)
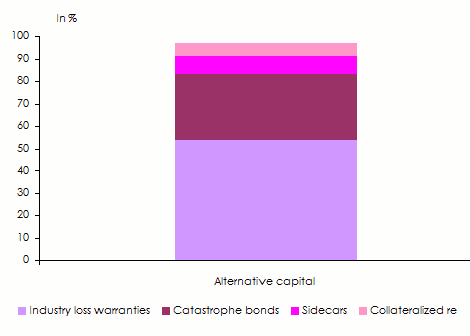 Source: Aon Benfield Analytics
Merger-acquisition activity
The search for scale economy, in a particularly-lively competitive context, makes good sense for non life reinsurers, especially that merger-acquisition operations are stimulated during periods of capital abundance. In the course of recent years, the reinforcement of ERM (Enterprise Risk Management) policies, the low levels of catastrophic claims and the stability of reinsurers’ ratings have prompted consolidation moves.
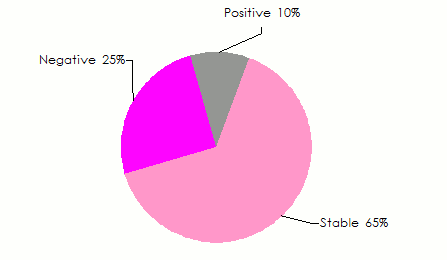
The impact of consolidation moves on reinsurers’ ratings has not been prejudicial to the players who carried out acquisitions:
Outlook on acquirers upon announcement of acquisition
Outlook on acquirers 6-14 months after announcement of acquisition
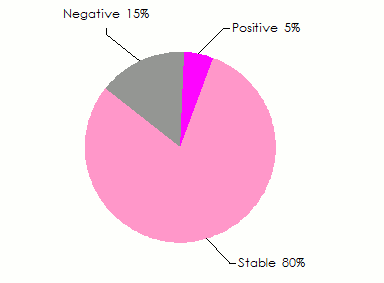 Source : Aon Benfield Analytics
 While a large number of transactions saw the light of day in 2016 (Ace/Chubb, Tokio Marine/HCC, Exor/Partner Re, Mitsui/Amlin, XL/Catlin, Fairfax/Brit, Willis/Towers Watson), the trend has particularly slowed down in 2017. This pause has been accounted for by the following reasons:
- the number of quality target reinsurers has declined,
- the market capitalization of players is now on a high bracket,
- particularly competitive environment restricts visibility, especially the identification of reinsurers able to maintain an attractive portfolio in terms of profitability,
- the high loss experience during the 2017 summer season has induced players to shift their attention to financial results.
However, the significant increase of natural catastrophes' loss experience during the recent months may, very soon, pave the way for new concentrations. SCOR, relatively spared by recent events, has not ruled out the prospect of consolidation should this opportunity come up.
Merger and acquisition deals: July 2017- November 2014
| Announced transaction | Closed transaction | Acquirer | Acquiree | Purchase price | Terms of the transaction |
|---|---|---|---|---|---|
July 2017 | Ongoing | AXIS Capital | Novae Group | 600 | Cash |
May 2017 | Ongoing | Intact Financial Corp | OneBeacon Insurance Group | 1 700 | Cash |
December 2016 | July 2017 | Fairfax Financial | Allied World Assurance | 4 900 | Stock and cash |
December 2016 | May 2017 | Liberty Mutual Group | Ironshore | 2 940 | Cash |
November 2016 | April 2017 | AXIS Capital | Aviabel Cie. Belge d’Assurances Aviation | NA | NA |
November 2016 | February 2017 | Argo Group US | Ariel Re | 240 | Cash and debt |
October 2016 | April 2017 | PartnerRe | Aurigen Capital | 290 | Cash |
October 2016 | March 2017 | Sompo | Endurance Specialty | 6 300 | Cash |
September 2016 | December 2017 | Canada Pension Plan Investment Board | Ascot Underwriting | 1 100 | Cash |
August 2016 | January 2017 | Arch Capital Group | United Guaranty | 3 400 | Stock and cash |
April 2016 | November 2016 | AmTrust Financial Services | ANV Holdings B.V. | 200 | Cash |
September 2015 | February 2016 | Mitsui Sumitomo Insurance | Amlin | 5 300 | Cash |
August 2015 | January 2016 | Sumitomo Life Insurance | Symetra Financial | 3 800 | Cash |
August 2015 | March 2016 | EXOR | PartnerRe | 6 900 | Cash |
July 2015 | April 2016 | China Minsheng Banking | Sirius International Insurance Group | 2 600 | Cash |
July 2015 | March 2016 | Meiji Yasuda Life Insurance | StanCorp Financial Group | 4 950 | Cash |
July 2015 | January 2016 | ACE Ltd. | Chubb Corp | 28 300 | Cash, actions et dette |
June 2015 | October 2015 | Tokio Marine & Nichido Fire Insurance | HCC Insurance | 7 530 | Cash and debt |
May 2015 | November 2015 | Fosun International | Ironshore | 2 300 | Cash |
March 2015 | July 2015 | Endurance Specialty | Montpelier Re | 1 830 | Cash and stock |
February 2015 | July 2015 | Fairfax Financial | Brit Insurance | 1 880 | Cash |
January 2015 | May 2015 | XL Group | Catlin Group | 4 100 | Cash, stock and debt |
November 2014 | March 2015 | Renaissance Re | Platinum Underwriters | 1 900 | Cash and stock |
| Total | 93 050 | ||||
* Only major transactions are reported in the table above Source : S&P Global Reinsurance Highlights
Reinsurance reneweal 2018: tariff trends
The exceptional loss experience of the last quarter of 2017 will strain reinsurance treaties' renewal terms in 2018. These particularly destructive events are likely to impact reinsurance terms and conditions offered on January 1.
Within two weeks, hurricanes Harvey (Category 4), Irma (Category 5) and Maria (Category 5) have successively lashed the Caribbean, Mexico and Southeast United States claiming numerous lives and causing substantial material damage. Harvey’s passage to Texas has claimed the lives of 90 people and caused approximately 190 billion USD in economic damage.
With gusts up to 295 km/hour, Irma, on its part, claimed the lives of 120 people and caused economic damage that may amount to 120 billion USD. Hurricane Maria occurred one week after Irma, with wind gusts up to 280 km/hour, ravaging in particular Porto Rico where similar storms have not been witnessed since 1928. Economic damage has been estimated between 50 and 91 billion USD while the number of deaths amounted to 70.
Mexico has also been hit by cyclones and sustained two powerful earthquakes:
- September 7, an 8.2 magnitude earthquake claimed the lives of 100 people, causing substantial material damage .
- September 19, a second 7.1 magnitude earthquake claimed the lives of more than 360 people in the State of Puebla near Mexico.
According to reinsurer SCOR, the five events of last August and September will cost insurers and reinsurers approximately 95 billion USD. This amount is to be added to the 23 billion USD of natural catastrophes reported by Swiss Re for the first half of the year.
QBE has already announced that 2017 may be the most onerous year ever for the insurance business. With regard to natural catastrophes loss experience, only 2005 and 2011 may compare with 2017. In 2005, Katrina cost the market 80 billion USD (sums adjusted by the end of 2016). In 2011, the damage caused by the Japanese Tsunami amounted to approximately 40 billion USD.
Major insurers and reinsurers have published initial estimates of their commitments in the damage reported during the occurrence of the five major events at the end of the summer season.
Loss estimate of the main insurers and reinsurers following the occurrence of major events during the summer of 2017
in millions USD| Company | Country | Amount |
|---|---|---|
Lloyd’s | United Kingdom | 4 500 |
Swiss Re | Switzerland | 3 600 |
Munich Re | Germany | 3 200 |
AIG | United States | 3 100 |
Chubb | Switzerland | 1 780 |
XL Catlin | Ireland | 1 480 |
Everest Re | Bermuda | 1 200 |
Talanx Group | Germany | 1 050 |
MS&AD | Japan | 977 |
Zurich | Switzerland | 700 |
Renaissance Re | Bermuda | 625 |
QBE | Australia | 600 |
Allstate Corporation | United States | 593 |
Axis Capital | Bermuda | 578 |
Markel | United States | 503 |
PartnerRe | Bermuda | 475 |
Universal Insurance | United States | 450 |
Scor | France | 430 |
Validus | Bermuda | 412 |
Arch Capital | Bermuda | 345 |
Aspen Insurance | Bermuda | 310 |
Mapfre Re | Spain | 237 |
Hiscox | United Kingdom | 225 |
Hannover Re | Germany | 225 |
Chaucer | Germany | 135 |
With such an amount of losses reported in 2017, the market is logically poised to react and stiffen the terms of the 2018 renewal.
 |
In North America, particularly in the United States, this approach has very good chances of being respected, with a rate increase justifying it.
Ceding companies on the European, Middle Eastern and African markets are in better situation than their American counterparts. These markets have been spared disaster claims in 2017.
The abundance of capacity provided in particular by numerous regional players will continue to support insurers, especially that retentions are not showing signs of decrease. In these areas, it is obvious that 2018 will be stable in terms of tariff erosion while the so long-awaited tightening by the market players will not be on the horizon for some time to come.