United Arab Emirates insurance market: 2011-2012 results
UAE insurance market 2011-2012: Turnover per company and per class of business
in thousands USD| 2011 | 2012 | 2011-2012 evolution | 2012 shares | |
|---|---|---|---|---|
| National companies | ||||
Accident and third party liability | 1 587 851 | 1 590 333 | 0.2% | 22.2% |
Fire | 484 436 | 442 722 | -8.6% | 6.2% |
Marine 1 | 495 931 | 463 902 | -6.5% | 6.5% |
Miscellaneous accident | 131 991 | 146 008 | 10.6% | 2% |
Health | 1 271 738 | 1 372 890 | 8% | 19.2% |
Total non life | 3 971 947 | 4 015 855 | 1.1% | 56.1% |
life | 381 193 | 491 783 | 29% | 6.9% |
Total national companies | 4 353 140 | 4 507 638 | 3.5% | 63% |
| Foreign companies | ||||
Accident and third party liability | 576 054 | 585 956 | 1.7% | 8.2% |
Fire | 200 056 | 215 932 | 7.9% | 3% |
Marine 1 | 139 283 | 168 091 | 20.7% | 2.4% |
Miscellaneous accident | 83 019 | 148 679 | 79.1% | 2.1% |
Health | 265 824 | 396 701 | 49.2% | 5.5% |
Total non life | 1 264 236 | 1 515 359 | 19.9% | 21.2% |
life | 896 657 | 1 130 560 | 26.1% | 15.8% |
Total foreign companies | 2 160 893 | 2 645 919 | 22.4% | 37% |
| National and foreign companies | ||||
Total non life market | 5 236 183 | 5 531 214 | 5.6% | 77.3% |
Total life market | 1 277 850 | 1 622 343 | 27% | 22.7% |
Grand total life and non life | 6 514 033 | 7 153 557 | 9.8% | 100% |
UAE insurance market 2011-2012: Turnover of the main national companies
in thousands USD| 2011 | 2012 | 2011-2012 evolution | 2012 shares | |
|---|---|---|---|---|
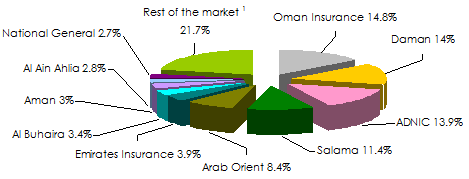
Oman Insurance | 637 625 | 665 203 | 4.3% | 14.8% |
Daman National health | 586 000 | 632 000 | 7.8% | 14.0% |
ADNIC | 562 529 | 625 954 | 11.3% | 13.9% |
Salama | 617 596 | 515 239 | -16.6% | 11.4% |
Arab Orient | 344 518 | 381 186 | 10.6% | 8.4% |
Emirates Insurance Co. | 175 165 | 175 661 | 0.3% | 3.9% |
Al Buhaira | 170 696 | 152 253 | -10.8% | 3.4% |
Dubai Islamic Insurance & Reinsurance (Aman) | 138 964 | 134 457 | -3.2% | 3.0% |
Al Ain Ahlia | 137 180 | 125 839 | -8.3% | 2.8% |
National General Insurance | 118 530 | 122 215 | 3.1% | 2.7% |
Total of the top ten national companies | 3 488 803 | 3 530 007 | 1.2% | 78.3% |
Rest of the national market 1 | 864 337 | 977 631 | 13.1% | 21.7% |
Total of the national market | 4 353 140 | 4 507 638 | 3.5% | 100% |
UAE: Market shares of the main national insurance companies in 2012
UAE insurance market 2011-2012: Gross incurred losses per class of business
in thousands USD| 2011 | 2012 | 2011-2012 evolution | 2012 shares | |
|---|---|---|---|---|
| National companies | ||||
Accident and third party liability | 732 659 | 922 136 | 25.9% | 22.3% |
Fire | 255 176 | 388 089 | 52.1% | 9.4% |
Marine 1 | 142 291 | 135 624 | -4.7% | 3.2% |
Miscellaneous accident | 70 807 | 44 426 | -37.3% | 1.1% |
Health | 1 010 883 | 1 156 062 | 14.4% | 27.9% |
Total non life | 2 211 816 | 2 646 337 | 19.6% | 63.9% |
life | 147 510 | 214 098 | 45.1% | 5.2% |
Total national companies | 2 359 326 | 2 860 435 | 21.2% | 69.1% |
| Foreign companies | ||||
Accident and third party liability | 239 025 | 302 110 | 26.4% | 7.3% |
Fire | 101 000 | 215 158 | 113% | 5.2% |
Marine 1 | 66 912 | 77 969 | 16.5% | 1.9% |
Miscellaneous accident | 46 541 | 174 355 | 274.6% | 4.2% |
Health | 178 443 | 272 299 | 52.6% | 6.6% |
Total non life | 631 921 | 1 041 891 | 64.9% | 25.2% |
life | 210 672 | 237 548 | 12.8% | 5.7% |
Total foreign companies | 842 593 | 1 279 439 | 51.8% | 30.9% |
| National and foreign companies | ||||
Total non life market | 2 843 737 | 3 688 228 | 29.7% | 89.1% |
Total life market | 358 182 | 451 646 | 26.1% | 10.9% |
Grand total life and non life | 3 201 919 | 4 139 874 | 29.3% | 100% |
Exchange rate as at AED/USD au 31/12 | 2011 | 2012 |
0.2723 | 0.27226 |

Live coverage
04/18

04/18
04/18
04/18
04/17
Latest news