Operational as of January 1986 in the form of a monoline company, CAAT had for a few years consecrated State monopoly over various insurance operations such as marine, land and air transport. In 1989, the company modified its status and proceeded to the broadening of all its classes of business.
Other structural evolutions followed, especially after the lifting of State monopoly over insurance operations and the separation of non-life insurance operations from personal insurance.
Nowadays, CAAT, a non-life company, stands as the second insurer of the market after SAA. It remains the leader of marine activities while gradually increasing its turnover in the other classes of business, especially in industrial risks.
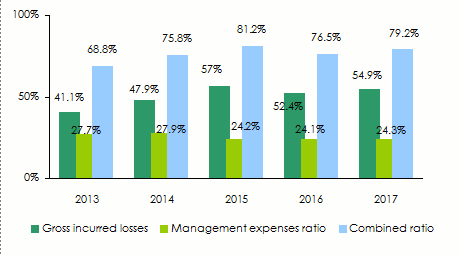
The company’s fundamentals are sound, shareholder’s equity worth about 200 million USD, a turnover in Algerian dinars growing constantly, a combined ratio set between 68.8% and 81.2% in the last five years, an average net result of 9.85% of the written premiums during the period between 2013 and 2017 and approximately annual 11% in return on investment. One of the most flattering assessment.
 |
| Youcef Benmicia |
| Chairman |
CAAT in 2017
| Share capital | 139 648 000 USD |
| Turnover | 200 744 000 USD |
| Assets | 540 630 000 USD |
| Shareholder’s equity | 198 815 000 USD |
| Net result | 21 916 000 USD |
| Gross loss ratio | 54.9% |
| Management expenses ratio | 24.3% |
| Combined ratio | 79.2% |
| Return on equity | 10.87% |
| Number of regional branches | 9 |
| Number of employees | 1 615 |
Shareholding
| Algerian State | 100% |
Management
| Chairman | Youcef Benmicia |
| Administration and finance manager | Mohamed Kamel Ihadjadene |
| Head of technical business | Hocine Bouarour |
| Development manager | Hamid Hamadouche |
CAAT : main technical highlights (2013-2017)
in thousands DZD
| 2013 | 2014 | 2015 | 2016 | 2017 | |
|---|---|---|---|---|---|
Gross written premiums | 18 113 889 | 20 192 356 | 21 160 079 | 22 615 696 | 23 000 000 |
Written premiums net of reinsurance | 10 535 400 | 11 848 609 | 11 733 477 | 12 416 786 | 12 358 210 |
Gross earned premiums | 17 671 348 | 19 765 232 | 21 566 597 | 22 147 725 | 22 966 728 |
Gross incurred losses | 7 265 588 | 9 460 204 | 12 294 445 | 11 595 084 | 12 615 856 |
Management expenses | 5 009 396 | 5 628 269 | 5 117 016 | 5 455 905 | 5 600 000 |
Gross loss ratio | 41.1% | 47.9% | 57% | 52.4% | 54.9% |
Expenses ratio(1) | 27.7% | 27.9% | 24.2% | 24.1% | 24.3% |
Combined ratio | 68.8% | 75.8% | 81.2% | 76.5% | 79.2% |
Technical result | 2 092 556 | 1 519 315 | 2 139 378 | 2 339 806 | 2 573 417 |
Financial income | 600 320 | 684 357 | 799 079 | 861 228 | 842 380 |
Net result | 1 925 666 | 1 574 132 | 2 069 022 | 2 337 768 | 2 510 946 |
in thousands USD
| 2013 | 2014 | 2015 | 2016 | 2017 | |
|---|---|---|---|---|---|
Gross written premiums | 233 126 | 231 001 | 198 524 | 205 486 | 200 744 |
Written premiums net of reinsurance | 135 591 | 135 548 | 110 083 | 112 819 | 107 862 |
Gross earned premiums | 227 430 | 226 114 | 202 338 | 201 234 | 200 454 |
Gross incurred losses | 93 508 | 108 225 | 115 346 | 105 353 | 110 111 |
Management expenses | 64 471 | 64 387 | 48 008 | 49 572 | 48 877 |
Gross loss ratio | 41.1% | 47.9% | 57% | 52.4% | 54.9% |
Expenses ratio(1) | 27.7% | 27.9% | 24.2% | 24.1% | 24.3% |
Combined ratio | 68.8% | 75.8% | 81.2% | 76.5% | 79.2% |
Technical result | 26 931 | 17 381 | 20 072 | 21 259 | 22 461 |
Financial income | 7 726 | 7 829 | 7 497 | 7 825 | 7 352 |
Net result | 24 783 | 18 008 | 19 412 | 21 241 | 21 916 |
CAAT : evolution of premiums, losses and results (2013-2017)
in thousands DZD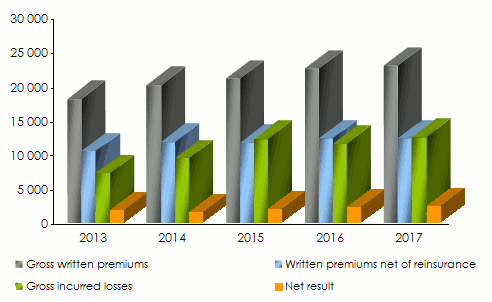
CAAT : evolution of ratios (2013-2017)
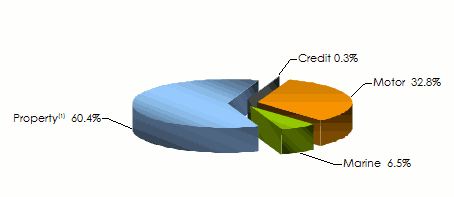
CAAT : breakdown of turnover per class of business (2013-2017)
in thousands DZD
| 2013 | 2014 | 2015 | 2016 | 2017 | 2017 shares | |
|---|---|---|---|---|---|---|
Motor | 7 249 700 | 7 798 577 | 7 650 782 | 7 892 566 | 7 553 000 | 32.8% |
Marine | 1 409 004 | 1 529 328 | 1 359 918 | 1 940 290 | 1 498 000 | 6.5% |
Property(1) | 9 453 337 | 10 863 204 | 12 147 911 | 12 776 690 | 13 882 000 | 60.4% |
Credit | 1 848 | 1 247 | 1 469 | 6 151 | 67 000 | 0.3% |
Total | 18 113 889 | 20 192 356 | 21 160 080 | 22 615 697 | 23 000 000 | 100% |
in thousands USD
| 2013 | 2014 | 2015 | 2016 | 2017 | 2017 shares | |
|---|---|---|---|---|---|---|
Motor | 93 304 | 89 216 | 71 780 | 71 712 | 65 923 | 32.8% |
Marine | 18 134 | 17 496 | 12 759 | 17 629 | 13 075 | 6.5% |
Property(1) | 121 664 | 124 275 | 113 972 | 116 089 | 121 162 | 60.4% |
Credit | 24 | 14 | 13 | 56 | 584 | 0.3% |
Total | 233 126 | 231 001 | 198 524 | 205 486 | 200 744 | 100% |
Breakdown of 2017 turnover per class of business
CAAT : incurred losses per non life class of business
in thousands DZD
| 2013 | 2014 | 2015 | 2016 | 2017 | |
|---|---|---|---|---|---|
Motor | 4 981 538 | 6 623 714 | 4 684 005 | 4 621 881 | 4 690 102 |
Marine | 214 353 | 49 192 | 134 969 | 106 971 | 375 682 |
Property(1) | 2 072 387 | 2 630 228 | 7 487 886 | 6 834 675 | 7 606 081 |
Credit | -2 691 | 157 071 | - 12 416 | 31 557 | -56 009 |
Total | 7 265 587 | 9 460 205 | 12 294 444 | 11 595 084 | 12 615 856 |
in thousands USD
| 2013 | 2014 | 2015 | 2016 | 2017 | |
|---|---|---|---|---|---|
Motor | 64 112 | 75 775 | 43 945 | 41 994 | 40 935 |
Marine | 2 759 | 563 | 1 266 | 972 | 3 279 |
Property(1) | 26 672 | 30 090 | 70 251 | 62 100 | 66 386 |
Credit | - 35 | 1 797 | -116 | 287 | - 489 |
Total | 93 508 | 108 225 | 115 346 | 105 353 | 110 111 |
CAAT : earned premiums per non life class of business : 2013-2017
in thousands DZD
| 2013 | 2014 | 2015 | 2016 | 2017 | |
|---|---|---|---|---|---|
Motor | 6 887 176 | 7 791 901 | 7 846 531 | 7 820 203 | 8 587 260 |
Marine | 770 994 | 798 736 | 870 988 | 760 932 | 907 186 |
Property(1) | 10 008 224 | 11 170 291 | 12 845 479 | 13 564 052 | 13 467 689 |
Credit | 4 954 | 4 304 | 3 599 | 2 538 | 4 593 |
Total | 17 671 348 | 19 765 232 | 21 566 597 | 22 147 725 | 22 966 728 |
in thousands USD
| 2013 | 2014 | 2015 | 2016 | 2017 | |
|---|---|---|---|---|---|
Motor | 88 638 | 89 139 | 73 616 | 71 054 | 74 950 |
Marine | 9 923 | 9 138 | 8 172 | 6 914 | 7 918 |
Property(1) | 128 806 | 127 788 | 120 516 | 123 243 | 117 546 |
Credit | 63 | 49 | 34 | 23 | 40 |
Total | 227 430 | 226 114 | 202 338 | 201 234 | 200 454 |
CAAT : Loss ratios per non life class of business : 2013-2017
| 2013 | 2014 | 2015 | 2016 | 2017 | |
|---|---|---|---|---|---|
Motor | 72.3% | 85.0% | 59.7% | 59.1% | 54.6% |
Marine | 27.8% | 6.2% | 15.5% | 14.1% | 41.4% |
Property(1) | 20.7% | 23.5% | 58.3% | 50.4% | 56.5% |
Credit | 54.3% | 3649.4% | 345.0% | 1243.4% | 1219.4% |
Total | 41.1% | 47.9% | 57.0% | 52.4% | 54.9% |
Source: CAAT Assurances
Exchange rate DZD/USD as at 31/12 | 2013 | 2014 | 2015 | 2016 | 2017 |
0.012870 | 0.011440 | 0.009382 | 0.009086 | 0.008728 |

CAAT
| Head office | 52 Avenue des Frères Bouadou, Bir-Mourad-Rais Algiers, Algeria |
| Tel | +213 (0) 23 56 93 24/33 |
| Fax | +213 (0) 23 56 93 78/84 |
| Website | www.caat.dz [5] |