Kenindia Assurance Company

- Date de création: 6 décembre 1978 à Nairobi
- Branches: Vie et non vie
- Filiales:
- Kenya Pravack
- Kenindia Asset Management Company
- Tanzindia Assurance Company
- Nombre d’employés: 236
Kenindia Assurance Company en 2019
 |  |
M. N. Mehta Président du conseil d’administration | B. S. Sharma Directeur général |
Capital social | 5 486 580 USD |
Chiffre d’affaires | 79 026 967 USD |
Actifs | 488 007 000 USD |
Fonds propres | 34 362 323 USD |
Résultat net | -1 862 014 USD |
Ratio sinistres à primes net non vie | 97,30% |
Ratio frais de gestion net non vie | 45,41% |
Ratio combiné net non vie | 142,71% |
Management
| M. N. Mehta | Président du conseil d’administration |
| B. S. Sharma | Directeur général |
| J. Macharia | Directeur de l’exploitation (COO) |
| Mohan Jha | Directeur, finance |
| V. R. Kumar | Directeur, opérations |
| Uthup Joseph | Directeur, département vie |
Actionnariat
| Life Insurance Corporation of India | 10,21% |
| General Insurance Corporation of India | 9,19% |
| National Insurance Company | 9,19% |
| New India Assurance Co. | 9,19% |
| United India Insurance Co. | 9,19% |
| Oriental Insurance Company | 9,00% |
| Sansora Investments | 7,90% |
| Chandaria Foundation Registered Trustees | 7,70% |
| Mehta Group | 6,17% |
| Lex Holdings | 4,58% |
| Autres | 17,68% |
Lire aussi | Augmentation du capital social des assureurs kényans
Kenindia Assurance Company : Principaux indicateurs techniques (2015-2019)
Chiffres en USD| Indicateurs | 2015 | 2016 | 2017 | 2018 | 2019 |
|---|---|---|---|---|---|
Primes émises brutes | 59 021 290 | 66 513 557 | 73 493 107 | 82 000 455 | 79 026 967 |
Primes émises brutes non vie | 27 494 890 | 28 701 297 | 28 939 507 | 27 861 735 | 24 141 607 |
Primes émises nettes | 47 948 602 | 55 486 383 | 62 651 482 | 72 320 351 | 70 257 134 |
Primes émises nettes non vie | 16 643 002 | 18 019 003 | 18 491 482 | 18 620 831 | 15 694 514 |
Primes acquises nettes non vie | 16 000 013 | 17 604 984 | 19 050 854 | 18 792 665 | 17 089 719 |
Charge de sinistres nette non vie | 10 957 046 | 11 893 417 | 12 840 490 | 13 320 809 | 16 627 878 |
Frais de gestion non vie | 6 090 989 | 6 907 381 | 7 704 173 | 7 664 674 | 7 127 097 |
Ratio sinistres à primes net non vie (1) | 68,48% | 67,56% | 67,40% | 70,88% | 97,30% |
Ratio frais de gestion net non vie (2) | 36,60% | 38,33% | 41,66% | 41,16% | 45,41% |
Ratio combiné net non vie (3) | 105,08% | 105,89% | 109,06% | 112,04% | 142,71% |
Résultat net | 7 592 736 | 2 654 235 | 2 354 496 | 3 212 602 | -1 862 014 |
(1) Ratio sinistres à primes = Charge de sinistres / Primes acquises
(2) Ratio frais de gestion = Frais de gestion / Primes émises
(3) Ratio combiné = Ratio sinistres à primes + Ratio frais de gestion
Kenindia Assurance Company : Répartition du chiffre d’affaires par branche (2015-2019)
Chiffres en USD| 2015 | 2016 | 2017 | 2018 | 2019 | Parts 2019 | |
|---|---|---|---|---|---|---|
Automobile | 7 680 663 | 8 312 940 | 8 083 651 | 9 082 149 | 7 318 531 | 9,26% |
Incendie | 7 116 672 | 7 844 305 | 7 832 170 | 6 204 237 | 5 578 326 | 7,06% |
Individuelle accident (1) | 3 944 208 | 4 391 261 | 4 507 306 | 4 063 029 | 3 566 913 | 4,51% |
Transport (2) | 2 513 808 | 2 467 626 | 2 674 233 | 2 760 206 | 2 418 770 | 3,06% |
Vol | 2 761 671 | 2 290 942 | 2 294 611 | 1 963 302 | 1 844 753 | 2,34% |
Engineering | 1 897 603 | 1 658 097 | 1 590 605 | 1 653 920 | 1 432 799 | 1,81% |
Maladie | 968 851 | 1 006 341 | 1 281 062 | 1 342 390 | 1 329 258 | 1,68% |
Responsabilité civile | 377 030 | 491 904 | 437 184 | 553 392 | 482 134 | 0,61% |
Risques divers | 234 384 | 237 881 | 238 685 | 239 110 | 170 123 | 0,22% |
| Total non vie | 27 494 890 | 28 701 297 | 28 939 507 | 27 861 735 | 24 141 607 | 30,55% |
Fonds de prestation de retraite | 21 494 189 | 24 113 483 | 28 361 203 | 34 931 284 | 34 572 515 | 43,75% |
Assurance vie individuelle | 9 611 155 | 9 834 454 | 11 856 739 | 14 133 720 | 15 786 954 | 19,98% |
Pensions et rentes | - | 3 291 822 | 3 621 619 | 4 607 315 | 4 034 123 | 5,10% |
Assurance groupe | 421 056 | 572 501 | 714 039 | 466 401 | 491 768 | 0,62% |
| Total vie | 31 526 400 | 37 812 260 | 44 553 600 | 54 138 720 | 54 885 360 | 69,45% |
| Total général | 59 021 290 | 66 513 557 | 73 493 107 | 82 000 455 | 79 026 967 | 100% |
(1)comprend les accidents du travail (2) comprend l’aviation et le transport maritime
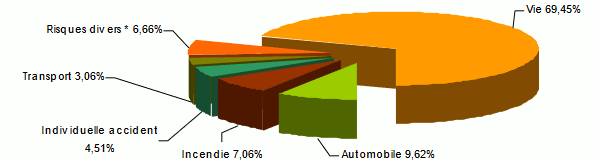
Répartition du chiffre d’affaires 2019 par branche
Kenindia Assurance Company : Primes émises nettes par branche non vie (2015-2019)
Chiffres en USD| 2015 | 2016 | 2017 | 2018 | 2019 | Evolution 2018-2019 (1) | |
|---|---|---|---|---|---|---|
Automobile | 7 367 338 | 7 961 344 | 7 838 093 | 8 829 745 | 7 094 901 | -19,81% |
Incendie | 1 331 702 | 1 674 067 | 1 508 314 | 1 133 770 | 896 327 | -21,10% |
Individuelle accident (2) | 3 358 426 | 4 096 121 | 4 159 642 | 3 732 244 | 3 233 855 | -13,53% |
Transport (3) | 2 108 621 | 1 947 116 | 2 032 262 | 2 185 879 | 1 933 917 | -11,71% |
Vol | 984 749 | 899 897 | 1 048 214 | 852 770 | 767 593 | -10,17% |
Engineering | 283 766 | 128 113 | 297 648 | 258 933 | 236 510 | -8,85% |
Maladie | 924 730 | 1 006 341 | 1 253 021 | 1 297 758 | 1 296 887 | -0,27% |
Responsabilité civile | 212 544 | 255 623 | 270 240 | 256 239 | 166 045 | -35,33% |
Risques divers | 71 126 | 50 381 | 84 048 | 73 493 | 68 479 | -7,01% |
| Total non vie | 16 643 002 | 18 019 003 | 18 491 482 | 18 620 831 | 15 694 514 | -15,89% |
(1) évolution en monnaie locale
(2) comprend les accidents du travail
(3) comprend l’aviation et le transport maritime
Kenindia Assurance Company : Ratios sinistres à primes nets par branche (2015-2019)
| 2015 | 2016 | 2017 | 2018 | 2019 | |
|---|---|---|---|---|---|
Automobile | 69,18% | 66,84% | 58,65% | 67,79% | 119,08% |
Incendie | 63,42% | 85,29% | 48,10% | 36,51% | 105,47% |
Individuelle accident (1) | 76,51% | 76,85% | 92,99% | 118,08% | 70,39% |
Transport (2) | 52,08% | 22,97% | 39,87% | 15,50% | 49,83% |
Vol | 63,39% | 77,71% | 62,13% | 53,60% | 93,72% |
Engineering | 44,31% | 137,22% | 196,27% | 89,27% | 76,79% |
Maladie | 96,68% | 91,03% | 101,18% | 94,06% | 102,55% |
Responsabilité civile | 49,77% | 58,04% | 56,81% | 36,46% | 181,66% |
Risques divers | -5,86% | 3,70% | 15,06% | -21,74% | 20,00% |
| Total non vie | 68,48% | 67,56% | 67,40% | 70,88% | 97,30% |
(1) comprend les accidents du travail (2) comprend l’aviation et le transport maritime
Kenindia Assurance Company : Ratios frais de gestion nets par branche (2015-2019)
| 2015 | 2016 | 2017 | 2018 | 2019 | |
|---|---|---|---|---|---|
| Automobile | 30,46% | 30,12% | 31,89% | 33,55% | 36,25% |
| Incendie | 66,85% | 79,78% | 101,28% | 91,37% | 127,23% |
| Individuelle accident (1) | 40,43% | 39,45% | 41,68% | 43,78% | 46,35% |
| Transport maritime (2) | 39,62% | 38,62% | 43,60% | 44,07% | 45,55% |
| Vol | 16,00% | 24,03% | 28,01% | 27,06% | 39,24% |
| Engineering | 74,68% | 184,21% | 75,13% | 94,92% | 93,40% |
| Maladie | 28,93% | 28,08% | 30,96% | 33,27% | 35,62% |
| Responsabilité civile | 51,63% | 48,33% | 45,74% | 54,18% | 71,36% |
| Risques divers | 23,32% | -104,43% | 33,71% | 29,92% | -98,70% |
| Total non vie | 36,60% | 38,33% | 41,66% | 41,16% | 45,41% |
Kenindia Assurance Company : Ratios combinés nets par branche (2015-2019)
| 2015 | 2016 | 2017 | 2018 | 2019 | |
|---|---|---|---|---|---|
Automobile | 99,64% | 96,96% | 90,54% | 101,34% | 155,33% |
Incendie | 130,27% | 165,07% | 149,38% | 127,88% | 232,70% |
Individuelle accident (1) | 116,94% | 116,30% | 134,67% | 161,86% | 116,74% |
Transport (2) | 91,70% | 61,59% | 83,47% | 59,57% | 95,38% |
Vol | 79,39% | 101,74% | 90,14% | 80,66% | 132,96% |
Engineering | 118,99% | 321,43% | 271,40% | 184,19% | 170,19% |
Maladie | 125,61% | 119,11% | 132,14% | 127,33% | 138,17% |
Responsabilité civile | 101,40% | 106,37% | 102,55% | 90,64% | 253,02% |
Risques divers | 17,46% | -100,73% | 48,77% | 8,18% | -78,70% |
| Total non vie | 105,08% | 105,89% | 109,06% | 112,04% | 142,71% |
(1) comprend les accidents du travail (2) comprend l’aviation et le transport maritime
Taux de change KES/USD au 31/12 | 2015 | 2016 | 2017 | 2018 | 2019 |
0,0096 | 0,00958 | 0,0096 | 0,00976 | 0,00978 |

Kenindia Assurance Company : Contact
| Siège social | Kenindia House, Loita Street ; PO Box 44372-00100 G.PO, Nairobi, Kenya |
| Tél | +254 (020) 3316099 / 2214439 |
| Fax | +254 (020) 2218380 |
kenindia [at] kenindia [dot] com | |
| Site web |
- Vous devez vous identifier ou créer un compte pour écrire des commentaires

En continu
24/04
24/04
24/04
24/04

23/04
Dernières news