Marché Kenyan de l'assurance : chiffre d'affaires 2017 par compagnie
Marché Kenyan de l'assurance vie : chiffre d’affaires par compagnie 2016-2017
Chiffres en milliers| Primes émises 2017 | Primes émises 2016 | Evolution 2016-2017 (1) | Parts de marché 2017 | |||
|---|---|---|---|---|---|---|
| En KES | En USD | En KES | En USD | |||
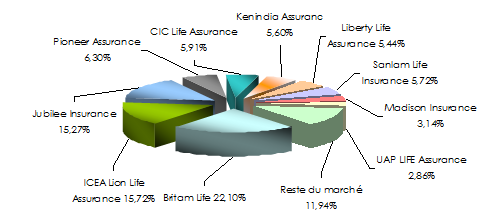
Britam Life | 18 297 485 | 178 949 | 17 179 320 | 170 762 | 6,51% | 22,10% |
ICEA Lion Life Assurance | 13 015 715 | 127 294 | 9 525 606 | 94 685 | 36,64% | 15,72% |
Jubilee Insurance Company | 12 643 723 | 123 656 | 10 360 845 | 102 987 | 22,03% | 15,27% |
Pioneer Assurance Company | 5 213 923 | 50 992 | 5 292 116 | 52 604 | -1,48% | 6,30% |
CIC Life Assurance Company | 4 895 175 | 47 875 | 4 352 847 | 43 267 | 12,46% | 5,91% |
Kenindia Assurance Company | 4 641 315 | 45 392 | 3 947 011 | 39 233 | 17,59% | 5,60% |
Liberty Life Assurance Company | 4 502 800 | 44 037 | 4 325 797 | 42 998 | 4,09% | 5,44% |
Sanlam Life Insurance | 4 738 729 | 46 345 | 4 669 643 | 46 416 | 1,48% | 5,72% |
Madison Insurance Company | 2 604 247 | 25 470 | 2 381 167 | 23 669 | 9,37% | 3,14% |
UAP Life Assurance Company | 2 365 623 | 23 136 | 2 581 975 | 25 665 | -8,38% | 2,86% |
Old Mutual Life Assurance | 1 919 636 | 18 774 | 2 038 363 | 20 261 | -5,82% | 2,32% |
GA Life Assurance Company | 1 618 442 | 15 828 | 1 525 305 | 15 162 | 6,11% | 1,95% |
APA Life Assurance Company | 1 492 952 | 14 601 | 1 223 439 | 12 161 | 22,03% | 1,80% |
Barclays Life | 1 380 330 | 13 500 | 1 252 818 | 12 453 | 10,18% | 1,67% |
The Kenyan Alliance Insurance | 778 597 | 7 615 | 812 717 | 8 078 | -4,20% | 0,94% |
Metropolitan Cannon Insurance | 609 958 | 5 965 | 393 863 | 3 915 | 54,87% | 0,74% |
Kenya Orient Life Assurance | 422 987 | 4 137 | 290 023 | 2 883 | 45,85% | 0,51% |
Prudential Life Assurance | 318 189 | 3 112 | 158 781 | 1 578 | 100,39% | 0,38% |
Capex Life Assurance Company | 313 340 | 3 064 | 56 647 | 563 | 453,14% | 0,38% |
Corporate Insurance Company | 278 949 | 2 728 | 295 766 | 2 940 | -5,69% | 0,34% |
Saham Assurance | 221 543 | 2 167 | 250 595 | 2 491 | -11,59% | 0,27% |
Geminia Insurance Company | 178 136 | 1 742 | 288 016 | 2 863 | -38,15% | 0,22% |
First Assurance Company | 168 783 | 1 651 | 103 450 | 1 028 | 63,15% | 0,20% |
Cannon Assurance Company | 81 846 | 800 | 116 719 | 1 160 | -29,88% | 0,10% |
Takaful Insurance Of Africa | 58 896 | 576 | 52 657 | 523 | 11,85% | 0,07% |
The Monarch Insurance | 46 507 | 455 | 43 695 | 434 | 6,44% | 0,06% |
Total | 82 807 826 | 809 861 | 73 519 181 | 730 781 | 12,63% | 100% |
(1) taux de croissance en monnaie locale
Taux de change au 31/12/2017 : 1 KES = 0,00978 USD; au 31/12/2016 : 1 KES = 0,00994 USD.
Parts de marché 2017 des dix premières compagnies vie au Kenya
Marché Kenyan de l'assurance non vie : chiffre d’affaires par compagnie 2016-2017
Chiffres en milliers| Primes émises 2017 | Primes émises 2016 | Evolution 2016-2017 (1) | Parts de marché 2017 | |||
|---|---|---|---|---|---|---|
| En KES | En USD | En KES | En USD | |||
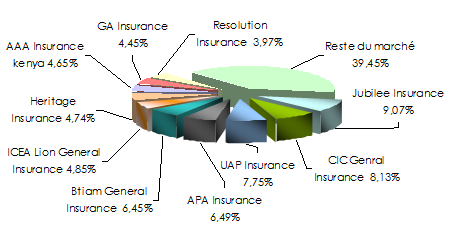
Jubilee Insurance Company | 11 313 366 | 110 645 | 14 089 298 | 140 048 | -19,70% | 9,07% |
CIC General Insurance Company | 10 141 110 | 99 180 | 8 407 498 | 83 571 | 20,62% | 8,13% |
UAP Insurance Company | 9 668 823 | 94 561 | 10 982 069 | 109 162 | -11,96% | 7,75% |
APA Insurance Company | 8 100 695 | 79 225 | 8 995 974 | 89 420 | -9,95% | 6,49% |
Britam General Insurance | 8 042 401 | 78 655 | 6 997 226 | 69 552 | 14,94% | 6,45% |
ICEA Lion General Insurance | 6 051 487 | 59 184 | 6 304 587 | 62 668 | -4,01% | 4,85% |
Heritage Insurance Company | 5 914 746 | 57 846 | 5 340 179 | 53 081 | 10,76% | 4,74% |
AAA Insurance Kenya | 5 799 296 | 56 717 | 6 489 197 | 64 503 | -10,63% | 4,65% |
GA Insurance Company | 5 547 253 | 54 252 | 4 782 084 | 47 534 | 16,00% | 4,45% |
Resolution Insurance Company | 4 947 647 | 48 388 | 3 926 111 | 39 026 | 26,02% | 3,97% |
Madison Insurance Company | 3 887 817 | 38 023 | 3 102 440 | 30 838 | 25,31% | 3,12% |
AIG Insurance Company | 3 647 387 | 35 671 | 3 669 939 | 36 479 | -0,61% | 2,92% |
Geminia Insurance Company | 3 367 416 | 32 933 | 2 223 150 | 22 098 | 51,47% | 2,70% |
Directline Assurance Company | 3 086 231 | 30 183 | 3 224 740 | 32 054 | -4,30% | 2,47% |
Kenindia Assurance Company | 2 966 570 | 29 013 | 2 995 960 | 29 780 | -0,98% | 2,38% |
First Assurance Company | 2 907 036 | 28 431 | 3 930 952 | 39 074 | -26,05% | 2,33% |
Occidental Insurance Compnay | 2 586 468 | 25 296 | 2 033 090 | 20 209 | 27,22% | 2,07% |
African Merchant Assurance | 2 470 947 | 24 166 | 3 162 248 | 31 433 | -21,86% | 1,98% |
Fidelity Shield Insurance | 2 360 848 | 23 089 | 1 717 327 | 17 070 | 37,47% | 1,89% |
Mayfair Insurance Company | 2 353 359 | 23 016 | 2 302 051 | 22 882 | 2,23% | 1,89% |
Sanlam General Insurance | 2 154 916 | 21 075 | 1 002 199 | 9 962 | 115,02% | 1,73% |
Saham Insurance Company | 2 138 854 | 20 918 | 1 563 081 | 15 537 | 36,84% | 1,71% |
Invesco Assurance Company | 2 070 192 | 20 246 | 2 300 894 | 22 871 | -10,03% | 1,66% |
Kenya Orient Insurance | 1 847 116 | 18 065 | 2 525 565 | 25 104 | -26,86% | 1,48% |
Trident Insurance Company | 1 331 851 | 13 026 | 1 295 773 | 12 880 | 2,78% | 1,07% |
Cannon Assurance Company | 1 269 815 | 12 419 | 1 725 576 | 17 152 | -26,41% | 1,02% |
Pacis Insurance Company | 1 217 078 | 11 903 | 1 042 138 | 10 359 | 16,79% | 0,98% |
The Monarch Insurance | 1 160 023 | 11 345 | 1 051 639 | 10 453 | 10,31% | 0,93% |
The kenyan Alliance Insurance | 1 156 074 | 11 306 | 1 095 923 | 10 893 | 5,49% | 0,93% |
Tausi Assurance Company | 1 045 524 | 10 225 | 963 338 | 9 576 | 8,53% | 0,84% |
Intra-Africa Assurance | 1 034 427 | 10 117 | 1 014 260 | 10 082 | 1,99% | 0,83% |
Takaful Insurance Of Africa | 847 828 | 8 292 | 816 450 | 8 116 | 3,84% | 0,68% |
XPLICO Insurance Company | 804 370 | 7 867 | 1 229 298 | 12 219 | -34,57% | 0,64% |
Phoenix Of East Africa | 557 912 | 5 456 | 438 726 | 4 361 | 27,17% | 0,45% |
Allianz Insurance Company | 346 886 | 3 393 | 63 060 | 627 | 450,09% | 0,28% |
Pioneer General Insurance | 325 518 | 3 184 | - | - | - | 0,26% |
Corporate Insurance Company | 310 323 | 3 035 | 312 615 | 3 107 | -0,73% | 0,25% |
Total | 124 779 610 | 1 220 345 | 123 116 655 | 1 223 780 | 1,35% | 100% |
(1) taux de croissance en monnaie locale
Taux de change au 31/12/2017 : 1 KES = 0,00978 USD; au 31/12/2016 : 1 KES = 0,00994 USD.
Parts de marché 2017 des dix premières compagnies non vie au Kenya
Marché Kenyan de l'assurance: chiffre d’affaires par branche vie et non vie 2016-2017
Chiffres en milliers| Primes émises 2017 | Primes émises 2016 | Evolution 2016-2017 (1) | Parts de marché 2017 | |||
|---|---|---|---|---|---|---|
| En KES | En USD | En KES | En USD | |||
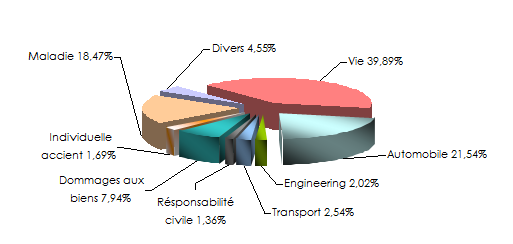
Automobile | 44 711 255 | 437 276 | 44 518 826 | 442 517 | 0,43% | 21,54% |
Engineering | 4 190 323 | 40 981 | 3 723 075 | 37 007 | 12,55% | 2,02% |
Transport (2) | 5 282 135 | 51 659 | 4 128 481 | 41 037 | 27,94% | 2,54% |
Responsabilité civile | 2 817 584 | 27 556 | 2 613 482 | 25 978 | 7,81% | 1,36% |
Dommage aux biens (3) | 16 485 752 | 161 231 | 15 946 244 | 158 506 | 3,38% | 7,94% |
Individuelle accident | 3 516 204 | 34 388 | 4 060 785 | 40 364 | -13,41% | 1,69% |
Maladie | 38 337 371 | 374 939 | 38 703 497 | 384 713 | -0,95% | 18,47% |
Divers(4) | 9 438 986 | 92 313 | 9 422 265 | 93 657 | 0,18% | 4,55% |
Total non vie | 124 779 610 | 1 220 345 | 123 116 655 | 1 223 780 | 1,35% | 60,11% |
Total vie(5) | 82 807 826 | 809 861 | 73 519 181 | 730 781 | 12,63% | 39,89% |
Total général | 207 587 436 | 2 030 205 | 196 635 836 | 1 954 560 | 5,57% | 100% |
Taux de change au 31/12/2017 : 1 KES = 0,00978 USD; au 31/12/2016 : 1 KES = 0,00994 USD.
(1) Taux de croissance en monnaie locale
(2) Comprend l’aviation
(3) Comprend le vol et l’incendie
(4) Comprend les accidents de travail
(5) Comprend les assurances groupe, la retraite et les polices en unités de compte
Parts de marché 2017 par branche vie et non vie
Lire aussi : Marché kenyan de l'assurance en 2018

- Vous devez vous identifier ou créer un compte pour écrire des commentaires
