Africa Re, a profitable company
As at 31.12.2014, Africa Re is:
- a turnover of 718 million USD
- a paid-up capital of 294 million USD
- a shareholders’ equity of 737 million USD
- 236 staff members
- a network of six regional offices, two subsidiaries and one local office(1)
- a rating of A- with positive outlook granted by A.M. Best and A- with stable outlook by Standard & Poor’s
- the leading African reinsurer(2)
Africa Re, evolution of turnover (1978(3) -2015)
in millions USD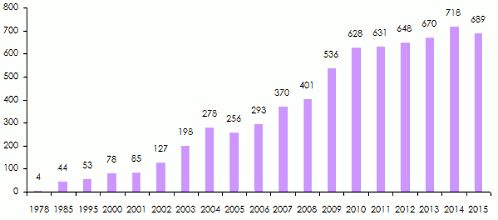
Despite an environment characterized by economic recession, recurrent civil wars and a strong depreciation of African currencies versus the US dollar, Africa Re has managed to report sustained growth of its turnover since its inception.
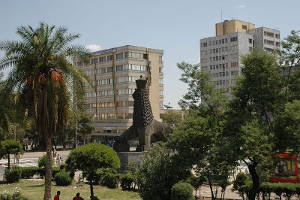 Addis-Ababa whrere Africa Re opened an office in 2011© VBzi , CC BY 2.0 Addis-Ababa whrere Africa Re opened an office in 2011© VBzi , CC BY 2.0 |
The decline in the 2005 turnover was accounted for by a change in the accounting method. In the course of the mentioned year, Africa Re gave up the Lloyd’s triennial accounting system to turn to the one provided for by the IFRS standard which is annual.
economic recession, recurrent civil wars and a strong depreciation of African currencies versus the US dollar, Africa Re has managed to report sustained growth of its turnover since its inception.
The decline in the 2005 turnover was accounted for by a change in the accounting method. In the course of the mentioned year, Africa Re gave up the Lloyd’s triennial accounting system to turn to the one provided for by the IFRS standard which is annual.
In 2015, the volume of written premiums sustains for the second time ever since the establishment of the company a slight decrease, going from 717.5 million USD in 2014 down to 689.3 million USD at the end of 2015, a decrease of 3.9%.
This decline is accounted for by the considerable erosion in 2014 of some African currencies against the US dollar. That is the case of South African currency, the Rand, which saw its value depreciated by 33% in a year, the Algerian Dinar (-22%) and the Nigerian Naira (-9%).
Below is the evolution trend of main currencies in the African markets versus the US dollar.
Evolution of African currencies against the US dollar
| Country | Currency | 1978* | 1990 | 2000 | 2010 | 2014 | 2015 | Variation rate 1978-2015 |
|---|---|---|---|---|---|---|---|---|
Algeria | DZD | 1$=3.9 DZD | 1$=7.8 DZD | 1$=75.9 DZD | 1$=75.8 DZD | 1$=88.3 DZD | 1$=107.6 DZD | -2659% |
South Africa | ZAR | 1$=0.9 ZAR | 1$=2.6 ZAR | 1$=7.6 ZAR | 1$=6.6 ZAR | 1$=11.6 ZAR | 1$=15.4 ZAR | -1611.1% |
Angola | AON | 1$=6.04 AON | 1$=6.04 AON | 1$=6 AON | 1$=92.9 AON | 1$=102.9 AON | 1$=136 AON | -2151.6% |
Egypt | EGP | 1$=0.4 EGP | 1$=1.4 EGP | 1$=3.9 EGP | 1$=5.8 EGP | 1$=7.2 EGP | 1$=7.8 EGP | -1850% |
Ethiopia | ETB | 1$=2.1 ETB | 1$=1.8 ETB | 1$=8.2 ETB | 1$=16.8 ETB | 1$=20.4 ETB | 1$=21.4 ETB | -919% |
Kenya | KES | 1$=7.7 KES | 1$=20.1 KES | 1$=78.1 KES | 1$=83.3 KES | 1$=92.3 KES | 1$=104.2 KES | -1253% |
Libya | LYD | 1$=0.3 LYD | 1$=0.2 LYD | 1$=0.5 LYD | 1$=1.3 LYD | 1$=1.2 LYD | 1$=1.4 LYD | -366.6% |
Morocco | MAD | 1$=4.5 MAD | 1$=7.2 MAD | 1$=10.5 MAD | 1$=8.5 MAD | 1$=9 MAD | 1$=9.9 MAD | -120% |
Nigeria | NGN | 1$=0.6 NGN | 1$=7 NGN | 1$=110.5 NGN | 1$=153.3 NGN | 1$=184.2 NGN | 1$=201.4 NGN | -33466.6% |
Tunisia | TND | 1$=0.4 TND | 1$=0.8 TND | 1$=1.4 TND | 1$=1.5 TND | 1$=1.9 TND | 1$=2 TND | -400% |
FCFA | XOF | 1$=225.6 XOF | 1$=238.7 XOF | 1$=699.3 XOF | 1$=504.7 XOF | 1$=539.6 XOF | 1$=600.3 XOF | -166% |
Africa Re, shareholders’ equity: 1976-2014
in millions USD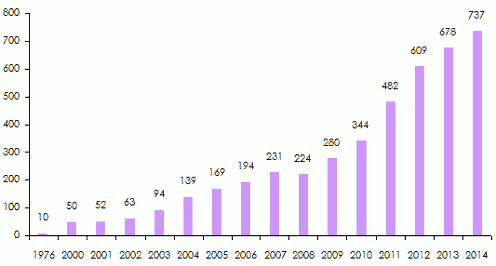 Source: Atlas Magazine
Africa Re, paid-up capital: 1976-2014
in millions USD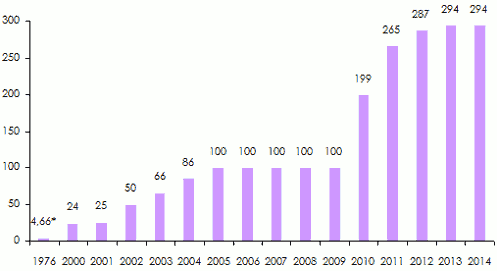 * Paid-up capital: 4 600 000 USD, authorized capital: 15 000 000 USD, subscribed capital: 10 000 000 USD Source: Atlas Magazine
  |
From 2000 to 2015, Africa Re’s shareholders' equity went fifteen fold, rising from 50 million USD to 737 million USD. This growth rate of shareholder’s equity is clearly above that of the premiums which went approximately nine fold.
While shareholders' equity went fifteen fold during the period considered, The paid-up capital rose from 24 million USD to 294 million USD, that is, twelve times as much as the initial period.
This gap between the increase in shareholders' equity and share capital showcases some consolidation concern regarding the company’s financial bases at the detriment of a policy for the allocation of dividends to shareholders.
Shareholders' equity consolidation has been carried out on two fronts: the increase of share capital and the establishment of substantial reserves from the profits generated.
Africa Re, net result: 2000-2014
in millions USD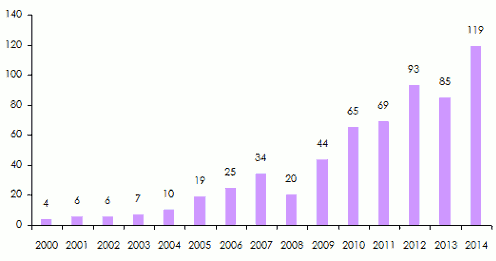 Source: Atlas Magazine
 In 2014, Africa Re’s net profits exceeded the symbolic threshold of 100 million USD to be set at 119 million USD, a 16.08% return on equity in one year. This rate is deemed to be excessively high given the current context of reinsurance worldwide.
Starting from 2009, the net profits marked a substantial upward trend: +48% in 2010, +35% in 2012, +40% in 2014.
During the recent 15 years (from 2000 to 2014), the total profits generated 606 million USD, approximately twice as much as the current paid up capital.
Profit allocation policy
As mentioned above, Africa Re has favoured the consolidation of shareholders' equity at the detriment of the dividend allocation policy.
In 2014, only 16.15 million USD were allocated to shareholders, that is, nearly 14% of the profits generated. With roughly 15.5% of the allocation in dividends, the year 2013, was in line with 2014.
The same scenario played out in 2012 with an allocation of 14% of profits.
Africa Re, premimus per region
Evolution of premiums per region: 2000-2014
in millions USD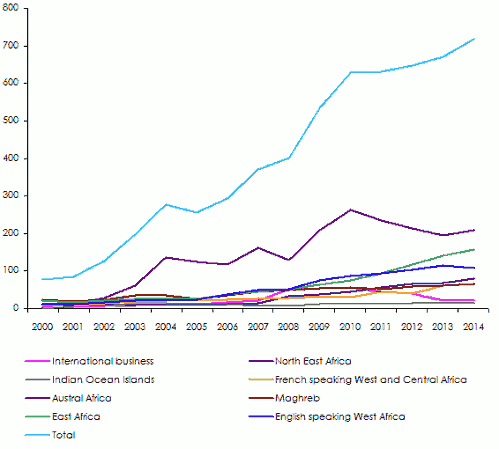 Source: Atlas Magazine
 Focused upon inception on three main zones, the Maghreb, East Africa and West Africa, underwriting has gradually shifted toward Austral Africa, which in 2004 and in 2005, accounted, alone, for nearly half the written premiums (49%).
Since that date, some readjustment has been carried out, reducing year after year the share of the premiums written in the southern cone of Africa, particularly in South Africa.
This adjustment has benefited English-speaking Eastern Africa and Western Africa that were progressing slowly. Kenya, on one side, and Nigeria, on the other side, stand as the future hubs of the African reinsurance industry.
Breakdown of premiums per region in 2014
Premiums in millions USD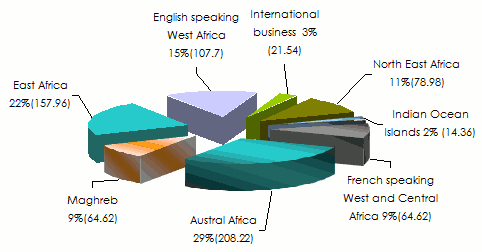
Total premiums in 2014: 718 million USD
In 2014, Austral Africa still remained at the top of the underwriting zones with 29% of the company's total turnover. English speaking Eastern and Southern Africa came second and third with 22% and 15% respectively. International business and in the islands of the Indian Ocean were lagging behind with 3% and 2% of the global premiums' volume.
Africa Re, premiums per class of business
Evolution of premiums per class of business: 2000-2014
in millions USD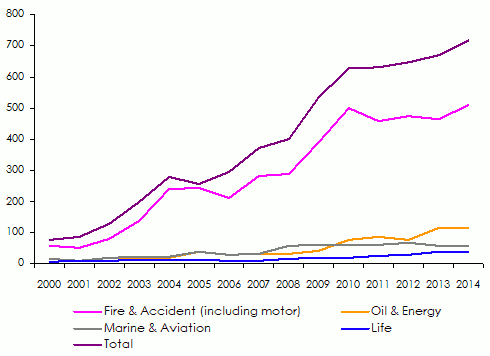 Source: Atlas Magazine
The graph above showcases a considerable gap between two groups of risks: damage to property and motor on the one hand, and marine, energy and life risks on the other. The first group ranks high on the standings with 75% of the portfolio, followed well behind by the other risks.
In fact, Africa Re has built its portfolio around traditional risks; motor and fire classes of business for which it is endowed with know-how and enough capacity. The pan African reinsurer has a large margin of progression in energy and marine which require a particular technical know-how and a huge underwriting capacity. The last two classes have been reinsured in specialized markets such as that of the Lloyd’s.
Starting from 2007, the statistics posted by Africa Re separately pointed out the fire and engineering risks on the one hand, and accident and motor risks on the other.
Africa Re, evolution of fire & engineering and accident & motor premiums: 2007-2014
| Fire & Engineering | Accident & Motor | Total | |||
|---|---|---|---|---|---|
| Premiums | % | Premiums | % | ||
| 2007 | 150.04 | 40.55% | 137.67 | 37.21% | 370 |
| 2008 | 166.86 | 41.61% | 122.35 | 30.51% | 401 |
| 2009 | 225.12 | 42% | 176.34 | 32.90% | 536 |
| 2010 | 256.16 | 40.79% | 228.59 | 36.40% | 628 |
| 2011 | 247.73 | 39.26% | 210.63 | 33.38% | 631 |
| 2012 | 268.01 | 41.36% | 204.57 | 31.57% | 648 |
| 2013 | 254.06 | 37.92% | 210.05 | 31.35% | 670 |
| 2014 | 281.60 | 39.22% | 226.82 | 31.59% | 718 |
Africa Re’s portfolio has for a long time been dominated by the fire-engineering class of business. The motor business is only second. The combined share of both classes of business during the 2000-2014 period is of 73.6%, a percentage that climbed to 80% in 2004.
Breakdown of premiums per class of business in 2014
Premiums in millions USD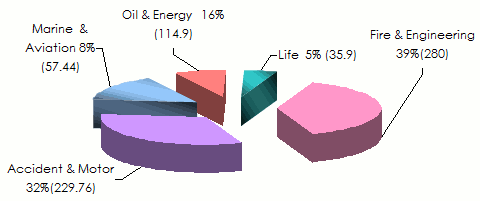
Total premiums in 2014: 718 million USD
Source: Atlas MagazineIn 2014, fire and motor insurance were pulling premium collections with respective shares of 39.22% and 31.59% of the turnover.
These classes are well ahead of marine transport-aviation risks, oil, energy and life risks.
Loss ratio per region
Africa Re, average loss ratios per region: 2000-2014(4)
| Region | Average loss ratios per region |
|---|---|
French speaking West and Central Africa | 34.82 % |
English speaking West Africa | 46.24 % |
East Africa | 46.66 % |
African Islands of the Indian Ocean | 47.30 % |
Maghreb | 47.99 % |
North East Africa | 56.93 % |
Austral Africa | 64.10 % |
International business | 66.72 % |
Average loss ratio of Africa Re | 54.17 % |
It is with international business and in Austral Africa that the average loss ratio of the 2000-2014 period is highest.
It is worth noting that the average loss ratio of the previously mentioned two zones is nearly double that of French-speaking Western Africa which detains the lowest ratio (34.82%).
English-speaking Western Africa has also had an excellent performance, and likewise for Eastern Africa, the African islands of the Indian Ocean and the Maghreb.
Loss ratio per classes of business
Africa Re, average loss ratios per non life insurance: 2000-2014(5)
| Class of business | Average loss ratios per class of business |
|---|---|
| Fire & Accident | 60.4% |
| Oil & Energy* | 44.57% |
| Marine & Aviation | 47.76% |
It is in the least developed classes of business that the lowest average loss ratio is reported. Not surprisingly, fire and motor are the most affected classes of business with an average loss ratio of 60.40% over 15 years. Despite this figure, Africa Re’s underwriting margin remains adequate in these two classes.
*Classification introduced as from 2003Management expenses
Africa Re, evolution of management expenses: 2000-2014 (6)
| Year | Overhead expenses/Gross written premiums | Acquisition costs/Gross written premiums | Management expenses ratio * |
|---|---|---|---|
| 2000 | 5.80% | 31.79% | 37.59 % |
| 2001 | 5.82% | 26.88% | 32.69% |
| 2002 | 4.26% | 22.99% | 27.25% |
| 2003 | 3.03% | 24.60% | 27.64% |
| 2004 | 2.71% | 24.33% | 27.04% |
| 2005 | 4.36% | 29.27% | 33.63% |
| 2006 | 4.38% | 25.80% | 30.19% |
| 2007 | 4.44% | 25.25% | 29.69% |
| 2008 | 4.34% | 25.90% | 30.23% |
| 2009 | 4.26% | 23.55% | 27.81% |
| 2010 | 4.31% | 25.75% | 30.06% |
| 2011 | 4.96% | 24.09% | 29.05% |
| 2012 | 4.77% | 24.24% | 29.01% |
| 2013 | 5.10% | 24.55% | 29.65% |
| 2014 | 5.26% | 25.20% | 30.46% |
Management expenses include overheads or administrative costs and acquisition costs or commissions disbursed to obtain business.
Overhead or administrative costs
Contained for so long under 5%, overhead costs have sustained an increase in 2013 and 2014, the years during which they climbed to 5.10% and 5.6% respectively of the written premiums. This rate was poised to continue its increase in 2015 because of the declining turnover.
By way of comparison, in 2014, SCOR, the world’s fifth reinsurer, posted a management expenses rate of 4.98%, and Hannover Re, a reference in the field, exhibited a rate of 2.58%.
Acquisition costs or commissions disbursed
It is by lowering its acquisition rate that Africa Re may consolidate in the future its combined ratio at its current level.
African direct markets are dominated by brokers who withhold high commission rates at source. This situation strains Africa Re in comparison with its international competitors.
In Africa, proportional reinsurance is still important. The high business acquisition cost by direct insurers has impacted the proportional treaties and facultative business underwritten by Africa Re.
In 2014, Africa Re’s acquisition rate was at 25.2% whereas the one of its international competitors, whose portfolios include many non-proportional treaties, was around 20%.
Combined ratios
Africa Re, evolution of gross combined ratios: 2000-2014 (7)
| Year | Gross combined ratios |
|---|---|
| 2000 | 84.41% |
| 2001 | 83.43% |
| 2002 | 80.16% |
| 2003 | 84.26% |
| 2004 | 87.37% |
| 2005 | 97.56% |
| 2006 | 86.09% |
| 2007 | 90.17% |
| 2008 | 92.48% |
| 2009 | 90.46% |
| 2010 | 88.18% |
| 2011 | 83.11% |
| 2012 | 88.11% |
| 2013 | 82.39% |
| 2014 | 79.92% |
With 97.56%, the year 2005 reported the highest combined ratio. Ever since, this ratio has notably gone down ending up for the first time since the establishment of the company under the rate of 80% in 2014.
These accomplishments are accounted for by extremely low loss experience rates, especially in the West African zone where an average loss experience of 34.82% has been reported during the recent 15 years. French-speaking West Africa and East Africa have also reported a rate below 50% in the course of the same period.
Premium retention rate: 2000-2014
in millions USD| Year | Underwritten premiums | Retained premiums | % |
|---|---|---|---|
| 2000 | 78 | 72 | 92.31% |
| 2001 | 85 | 76 | 89.41% |
| 2002 | 127 | 104 | 81.89% |
| 2003 | 198 | 164 | 82.83% |
| 2004 | 278 | 264 | 94.96% |
| 2005 | 256 | 239 | 93.36% |
| 2006 | 293 | 258 | 88.05% |
| 2007 | 370 | 336 | 90.81% |
| 2008 | 401 | 365 | 91.02% |
| 2009 | 536 | 487 | 90.86% |
| 2010 | 628 | 570 | 90.76% |
| 2011 | 631 | 555 | 87.96% |
| 2012 | 648 | 586 | 90.43% |
| 2013 | 670 | 569 | 84.93% |
| 2014 | 718 | 624 | 86.91% |
In spite of a slight decrease in the retention rate in 2013 and 2014 in comparison with 2012, Africa Re has retained on average between 85% and 90% of the business underwritten, with the remaining share being ceded. In fact, retrocession rate depends on the composition of the portfolio. The more major risks such as energy and aviation contained in the portfolio, the higher the retrocession.
On the contrary, a portfolio, essentially composed of simple risks such as the personal line ones (motor, health, etc), usually yields a poor retrocession.
The level of retention, the kind of retrocession program and the cost of retrocession on the international market are also decisive factors in terms of the premium retention level.
Africa Re's Management
1977-1984 period
| Position | Nationality | |
|---|---|---|
| Edward Mensah | General manager | Ghana |
| Kabisi Milanga | Assistant general manager | DR of Congo |
| Nabil Mohareb | Secretary general | Egypt |
1984-1993 period
| Position | Nationality | |
|---|---|---|
| Eyessus Work Zafu | General manager | Ethiopia |
| El Noman El Sanusi | Assistant general manager | Soudan |
| Bakary Kamara | Secrétaire général | Mauritania |
1993-2011 period
| Position | Nationality | |
|---|---|---|
| Bakary Kamara | General manager | Mauritania |
| James Abban | Assistant general manager (1994 - 1999) | Ghana |
| Haile Michael Kumsa | Assistant general manager (1999 - 2010) | Ethiopie |
| Ganiyu Musa | Assistant general manager (2006 -2011) | Nigeria |
July 2011 to-date
| Position | Nationality | |
|---|---|---|
| Corneille Karekezi | General manager | Rwanda |
| K.E.N. Aghoghovbia | Assistant general manager | Nigeria |
Performance of Africa Re compared to the other reinsurers
Figures as at 31.12.2014 in USD| Company | Share capital | Turnover | Shareholders’ equity | Net result after tax | ROE |
|---|---|---|---|---|---|
| Africa | |||||
Africa Re | 293 731 000 | 717 525 000 | 736 925 000 | 118 504 000 | 16.08% |
Munich Reinsurance Co. of Africa | 3 009 300 | 485 571 000 | 237 619 500 | 25 927 500 | 10.91% |
Société Centrale de Réassurance | 166 382 000 | 299 897 550 | 242 660 075 | 35 207 863 | 14.51% |
Hannover Reinsurance Africa | 6 273 000 | 265 315 660 | 64 820 000 | 956 100 | 1.48% |
Compagnie Centrale de Réassurance | 217 360 000 | 255 169 200 | 269 640 800 | 31 826 080 | 11.80% |
Kenya Re | 19 651 100 | 12 9932 100 | 224 503 500 | 35 230 400 | 15.69% |
RGA Reinsurance Company of South Africa | 4 480 000 | 125 454 000 | 13 525 000 | 1 791 000 | 13.24% |
Continental Re | 28 655 000 | 90 813 000 | 81 639 500 | 4 727 427 | 5.79% |
SCOR Africa | 12 928 500 | 81 395 250 | 20 595 000 | 1 657 692 | 8.05% |
Tunis Re | 51 101 000 | 49 892 201 | 71 508 412 | 5 974 091 | 8.35% |
| Middle East | |||||
Saudi Re | 266 530 000 | 148 268 000 | 217 868 000 | 2 889 000 | 1.33% |
Kuwait Re | 51 304 800 | 117 021 000 | 136 898 000 | -185 422 | - |
Arab Re | 75 000 000 | 81 647 636 | 92 586 948 | 564 879 | 0.61% |
Gulf Re | 200 000 000 | 55 316 000 | 180 316 000 | -27 326 000 | - |
Takaful Re | 125 000 000 | 18 429 000 | 82 310 000 | -8 941 000 | - |
| World | |||||
Munich Re | 714 426 000 | 59 322 744 000 | 36 838 000 000 | 3 854 763 000 | 10.46% |
Swiss Re | 37 468 000 | 33 276 000 000 | 35 930 000 000 | 3 500 000 000 | 9.74% |
Hannover Re | 146 601 494 | 17 458 635 000 | 10 032 546 000 | 1 198 125 000 | 11.94% |
Berkshire Hathaway | 78 313 000 | 194 673 000 000 | 243 027 000 000 | 883 000 000 | 0.36% |
SCOR | 1 845 326 000 | 13 756 069 000 | 6 964 344 000 | 622 402 000 | 8.94% |
Appendices
Atlas Magazine provides you with detailed appendices on the activities of Africa Re. To directly access the required information, please click on the appendix title mentioned in the list below.
- Loss ratios per region: 2000-2014
- Gross earned premiums and gross incurred losses, per region: 2000-2014
- Loss ratios per non life insurance: 2000-2014
- Gross earned premiums and gross incurred losses per class of business: 2000-2014
(2) See Renewal 2016, reinsurance directory, Atlas Magazine
(3) Publication date of the first balance sheet of Africa Re
(4) See details in Appendix V
(5) See details in Appendix VI
(6) See details in Appendix VII
(7) See details in Appendix VII