Al Sagr National Insurance Company
 Detained by distinguished Emirati businessmen, Al Sagr has relied on its Dubai head office to develop a network of eight branch offices which extends nationwide. Solidly established on homeland, the company has gradually gone international by setting up a subsidiary in Jordan, and very recently, a company in Saudi Arabia, named Al Sagr Cooperative Insurance.
The growth of the company is similar to that of the many Gulf insurers driven by region’s economic boom. The periods of very high premiums growth were followed by adjustment times during which insurance companies tended to slowdown their underwriting to better digest the results. It is the kind of economic growth adopted by the Gulf States that really accounted for the insurers’ volatile performance, with results characterized by ups and downs but with profits well above the losses.
Nowadays, Al Sagr has adopted a prudent profile, with a very restrictive underwriting policy which resulted in turnover decline for the last three years. The leaders are aiming at consolidating the financial foundation of the company which is listed in the Dubai stock market. Al Sagr has been granted a B+ (good) by A.M. Best.
Al Sagr National Insurance in 2011
| Share capital | 62 629 000 USD |
| Turnover | 107 972 344 USD |
| Total assets | 312 182 662 USD |
| Shareholder's equity | 156 546 363 USD |
| Net technical result | 4 269 450 USD |
| Net profit | 2 602 414 USD |
| Net loss ratio | 95.6% |
| Net expenses ratio | 34.5% |
| Net combined ratio | 130.1% |
| Number of branches | 8 in United Arab Emirates, 1 subsidiary in Jordan(Jordan Emirates Insurance PSC) |
| Rating | B+ (Good) by A.M. Best |
Management
| Director & CEO | Sami Shakhshir |
| General manager | Mutaz Dabbagh |
| Deputy general manager | Hussein Ismail Mohamed |
| Finance & administration manager | John Mathai |
| Marine department manager | Kesava Moorthy |
| Life & medical department manager | T.R. Santhosh Kumar |
| Motor department manager | Faraj Omari |
Main shareholders
| Gulf General Investment Co. | 50.22% |
| Abdullah O. Taryam | 9.47% |
| Near East Investment Co. | 8.75% |
| Enmaa Al Emarat for General Trading Co. | 7.5% |
| Amjad M. Al Dweik | 5% |
| Ayman M. Al Dweik | 5% |
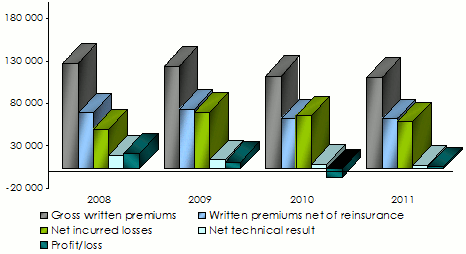
Main technical highlights: 2008-2011
in USD| 2008 | 2009 | 2010 | 2011 | |
|---|---|---|---|---|
Gross written premiums | 124 476 083 | 121 417 004 | 109 902 187 | 107 972 344 |
Written premiums net of reinsurance | 66 224 589 | 70 490 146 | 58 912 234 | 59 126 015 |
Net earned premiums | 57 727 267 | 75 053 404 | 64 792 987 | 58 025 064 |
Net incurred losses | 47 361 840 | 67 159 203 | 62 650 074 | 55 456 485 |
Management expenses | 18 648 326 | 17 570 779 | 22 003 073 | 20 374 622 |
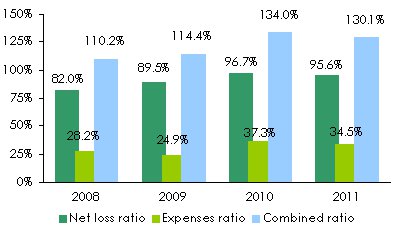
Net loss ratio | 82% | 89.5% | 96.7% | 95.6% |
Expenses ratio | 28.2% | 24.9% | 37.3% | 34.5% |
Combined ratio | 110.2% | 114.4% | 134.0% | 130.1% |
Net technical result | 15 975 861 | 10 598 526 | 5 918 451 | 4 269 450 |
Financial income | 3 787 629 | 3 001 118 | 501 428 | 928 143 |
Profit / loss | 18 269 528 | 8 180 092 | -10 060 478 | 2 602 414 |
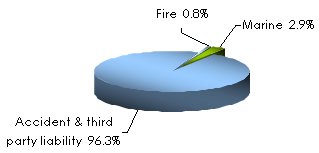
Net written premiums per class of business: 2008-2011
in USD| 2008 | 2009 | 2010 | 2011 | 2011 shares | 2010/11 evolution | |
|---|---|---|---|---|---|---|
Fire | 587 701 | 641 824 | 415 593 | 478 757 | 0.8% | 15.2% |
Marine | 1 958 327 | 2 406 763 | 2 668 836 | 1 694 780 | 2.9% | -36.5% |
Accident & TPL | 63 678 561 | 67 441 559 | 55 827 805 | 56 952 478 | 96.3% | 2% |
Total | 66 224 589 | 70 490 146 | 58 912 234 | 59 126 015 | 100% | 0.4% |
Breakdown per class of business in 2011
Net technical results per class of business: 2008-2011
in USD| 2008 | 2009 | 2010 | 2011 | 2010/11 evolution | |
|---|---|---|---|---|---|
Fire | 761 968 | 837 556 | 852 670 | 1 108 109 | 30% |
Marine | 4 747 628 | 4 164 708 | 3 536 641 | 4 621 810 | 30.7% |
Accident & third party liability | 10 466 265 | 5 596 262 | 1 529 140 | -1 460 469 | -195.5% |
Total | 15 975 861 | 10 598 526 | 5 918 451 | 4 269 450 | -27.9% |
Net earned premiums per class of business: 2008-2011
in USD| 2008 | 2009 | 2010 | 2011 | 2010/11 evolution | |
|---|---|---|---|---|---|
Fire | 508 515 | 655 412 | 549 244 | 441 286 | -19.7% |
Marine | 1 734 484 | 2 288 204 | 2 904 574 | 2 097 355 | -27.8% |
Accident & third party liability | 55 484 268 | 72 109 788 | 61 339 169 | 55 486 423 | -9.5% |
Total | 57 727 267 | 75 053 404 | 64 792 987 | 58 025 064 | -10.4% |
Net incurred losses per class of business: 2008-2011
in USD| 2008 | 2009 | 2010 | 2011 | 2010/11 evolution | |
|---|---|---|---|---|---|
Fire | 306 759 | 350 482 | 594 116 | 6 020 | -99% |
Marine | 1 925 340 | 1 795 398 | 2 482 990 | 28 474 | -98.9% |
Accident & third party liability | 45 129 741 | 65 013 323 | 59 572 968 | 55 421 991 | -7% |
Total | 47 361 840 | 67 159 203 | 62 650 074 | 55 456 485 | -11.5% |
Net loss ratios per class of business: 2008-2011
| 2008 | 2009 | 2010 | 2011 | 2010/11 evolution | |
|---|---|---|---|---|---|
Fire | 60.3% | 53.5% | 108.2% | 1.4% | -98.7% |
Marine | 111% | 78.5% | 85.5% | 1.4% | -98.4% |
Accident & third party liability | 81.3% | 90.2% | 97.1% | 99.9% | 2.8% |
Total | 82% | 89.5% | 96.7% | 95.6% | -1.2% |
Technical ratios: 2008-2011
Exchange rate AED/USD as at 31/12 | 2008 | 2009 | 2010 | 2011 |
0.27212 | 0.2722 | 0.27221 | 0.2723 |

Contact
| Head office | Al Hilal Building, 3rd Floor, Flat No. 301/302, Al Garhoud Road, PO Box 14614 & 10276, Dubai, United Arab Emirates |
| Phone | (+971) 4 702 8500 |
| Fax | (+971) 4 282 1873 |
asnic [at] eim [dot] ae | |
| Website |