Bahrain 2013
Turnover per company 2012-2013
in USD| 2012 turnover | 2013 turnover | 2013 shares | 2012-2013 evolution | |
|---|---|---|---|---|
| Traditional companies | ||||
Bahrain Kuwait Insurance | 59 233 424 | 62 675 484 | 9.1% | 5.8% |
Life Ins. Corporation (International) | 56 660 480 | 59 740 998 | 8.6% | 5.4% |
Axa Insurance (Gulf) | 47 047 747 | 49 610 736 | 7.2% | 5.4% |
Bahrain National Insurance | 39 814 325 | 43 947 739 | 6.4% | 10.4% |
Gulf Union Ins. & Re | 37 156 500 | 41 371 705 | 6% | 11.3% |
Al Ahlia Insurance | 29 697 614 | 30 519 189 | 4.4% | 2.8% |
Saudi National Insurance | 30 336 871 | 29 722 036 | 4.3% | -2% |
Bahrain National Life Assurance | 16 323 608 | 17 331 390 | 2.5% | 6.2% |
United Insurance | 14 058 356 | 16 528 887 | 2.4% | 17.6% |
Mediterranean & Gulf Ins & Re | 7 705 571 | 7 803 004 | 1.1% | 1.3% |
Saudi Arabian Insurance | 2 848 807 | 2 862 261 | 0.4% | 0.5% |
Legal & General Gulf | 1 496 021 | 1 982 182 | 0.3% | 32.5% |
Total | 342 379 324 | 364 095 611 | 52.7% | 6.3% |
| Takaful companies | ||||
Takaful International | 44 607 429 | 49 990 587 | 7.2% | 12.1% |
Solidarity General Takaful | 31 244 033 | 34 973 081 | 5.1% | 11.9% |
T’azur Company | 20 790 452 | 23 978 790 | 3.5% | 15.3% |
Medgulf Takaful | 26 718 834 | 22 023 357 | 3.2% | -17.6% |
Legal & General Gulf Takaful | 12 562 335 | 12 069 645 | 1.7% | -3.9% |
Chartis Takaful-Enaya | 6 440 318 | 10 033 962 | 1.4% | 55.8% |
Total | 142 363 401 | 153 069 422 | 22.1% | 7.5% |
Total of national companies | 484 742 725 | 517 165 033 | 74.8% | 6.7% |
| Foreign companies | ||||
Ace American Insurance | 44 013 264 | 53 842 601 | 7.8% | 22.3% |
American Life Insurance | 45 843 503 | 49 995 937 | 7.2% | 9.1% |
Zurich International Life | 25 946 951 | 34 981 106 | 5.1% | 34.8% |
The New India Assurance | 14 429 709 | 15 932 360 | 2.3% | 10.4% |
Royal & Sun Alliance Ins. | 8 331 565 | 7 032 601 | 1% | -15.6% |
Arabia Insurance Company | 6 206 897 | 6 337 099 | 0.9% | 2.1% |
Zurich Insurance Company | 2 371 353 | 3 156 512 | 0.5% | 33.1% |
Iran Insurance Company | 2 201 592 | 2 792 710 | 0.4% | 26.8% |
Total | 149 344 834 | 174 070 926 | 25.2% | 16.6% |
Grand total | 634 087 559 | 691 235 959 | 100% | 9% |
Turnover per life and non life insurance 2012-2013
in USD| 2012 | 2013 | 2012-2013 evolution | 2013 shares | |
|---|---|---|---|---|
| Non life insurance | ||||
Fire | 87 840 852 | 99 285 671 | 13% | 14.3% |
Property damage | 8 249 337 | 10 157 013 | 23.1% | 1.5% |
Marine | 15 270 558 | 14 322 004 | -6.2% | 2.1% |
Aviation | 3 331 565 | 1 939 382 | -41.8% | 0.3% |
Motor | 164 440 325 | 182 026 405 | 10.7% | 26.3% |
Engineering | 40 286 474 | 47 462 702 | 17.8% | 6.9% |
Third party liability | 14 647 215 | 16 820 463 | 14.8% | 2.4% |
Health | 98 580 906 | 109 228 683 | 10.8% | 15.8% |
Miscellaneous accident | 41 867 376 | 42 091 283 | 0.5% | 6.1% |
Total non life | 474 514 608 | 523 333 606 | 10.3% | 75.7% |
| Life insurance | ||||
Total life | 159 572 951 | 167 902 353 | 5.2% | 24.3% |
Grand total | 634 087 559 | 691 235 959 | 9% | 100% |
Turnover’s breakdown per class of business in 2013
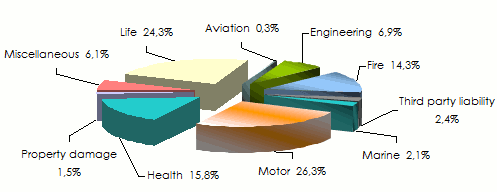 Source: Central Bank of Bahrain (CBB)
Exchange rate BHD/USD as at 31/12 | 2012 | 2013 |
2.65252 | 2.67501 |

Live coverage
17:24
17:17
15:28
09:18
04/18

Latest news