General Insurance Corporation of India (GIC Re)

- Creation date: 22 November 1972, Mumbai, India
- Classes of business: Life and non-life
- Rating: A.M Best / B++ / Stable
- Regional presence:
3 subsidiaries: South Africa, London and Moscow
3 Class of business: Dubai, Labuan and London
1 representation office in Brazil - Number of employees: 567
GIC Re in 2020
 |
Devesh Srivastava Chairman of the Board of Directors and CEO |
| Share capital | 116 580 000 USD |
| Turnover of | 6 781 904 000 USD |
| Total assets | 15 442 475 000 USD |
| Shareholder’s equity | 12 407 428 000 USD |
| Net result | 47 723 000 USD |
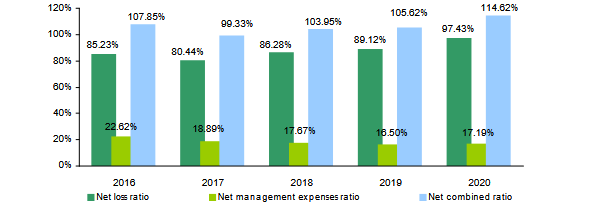
| Net non-life loss ratio | 97.43% |
| Net non-life management expenses ratio | 17.19% |
| Net non-life combined ratio | 114.62% |
Read also | GIC Re: results as at 30 June 2022
Management
| Devesh Srivastava | Chairman of the Board of Directors and Chief Executive Officer (CEO) |
| Suchita Gupta | Chief Financial Officer (CFO) |
| Deepak Prasad | Marketing and underwriting Manager |
| Jayashree Ranade | Investments Manager |
| Jayashri Balkrishna | Chief Risk Officer (CRO) |
| Madhulika Bhaskar | Director of Internal Audit |
| Satheesh Bhat | Actuary (non-life) |
| Vikash Kumar Sharma | Actuary (life) |
Shareholding as at 31/03/2020
| Indian State | 85.78% |
| Institutional Investors | 12.38% |
| Others | 1.84% |
GIC Re: main technical highlights
Figures in millions USD| Highlights | 2016 | 2017 | 2018 | 2019 | 2020 |
|---|---|---|---|---|---|
Gross written premiums | 2 780 | 5 176 | 6 425 | 6 357 | 6 782 |
Gross non-life written premiums | 2 745 | 5 120 | 6 357 | 6 279 | 6 655 |
Gross life written premiums | 35 | 56 | 67 | 78 | 127 |
Net written premiums | 2 469 | 4 650 | 5 784 | 5 604 | 6 201 |
Net non-life written premiums | 2 441 | 4 598 | 5 726 | 5 531 | 6 081 |
Net earned premiums | 2 288 | 4 117 | 5 855 | 5 414 | 5 867 |
Net non-life earned premiums | 2 252 | 4 081 | 5 797 | 5 345 | 5 762 |
Net incurred losses | 1 945 | 3 336 | 5 065 | 4 848 | 5 719 |
Net non-life incurred losses | 1 920 | 3 283 | 5 002 | 4 763 | 5 614 |
Management expenses | 554 | 870 | 1 012 | 914 | 1 047 |
Non-life management expenses | 552 | 868 | 1 012 | 913 | 1 045 |
Net non-life loss ratio (1) | - | - | - | - | - |
Net non-life management expenses ratio (2) | - | - | - | - | - |
Net non-life combined ratio (3) | - | - | - | - | - |
Net result after taxes | 430 | 482 | 497 | 320 | -48 |
* Fiscal year as at 31 March
(1) Net non-life loss ratio = Net non-life incurred losses / Net non-life earned premiums
(2) Non-life management expenses / Written premiums net of non-life reinsurance
(3) Net non-life combined ratio = Net non-life loss ratio + net non-life management expenses ratio
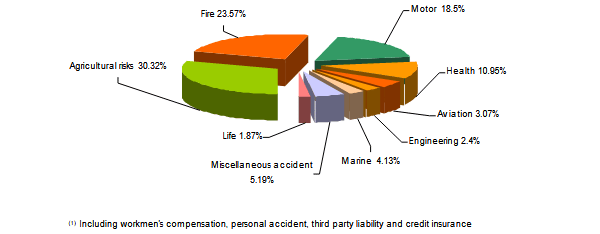
GIC Re: turnover breakdown per class of business
Figures in millions USD| Class of business | 2016 | 2017 | 2018 | 2019 |
|---|---|---|---|---|
Agricultural risks | 195 | 1 503 | 2 020 | 1 910 |
Fire | 977 | 1 252 | 1 537 | 1 482 |
Motor | 677 | 1 021 | 1 237 | 1 200 |
Health | 378 | 643 | 814 | 740 |
Marine | 153 | 172 | 204 | 255 |
Aviation | 68 | 102 | 115 | 163 |
Engineering | 134 | 135 | 152 | 148 |
Miscellaneous accident (1) | 164 | 291 | 279 | 382 |
Total non-life | 2 745 | 5 120 | 6 357 | 6 279 |
Life | 35 | 56 | 67 | 78 |
Grand total | 2 780 | 5 176 | 6 425 | 6 357 |
Turnover 2019 breakdown per class of business
GIC Re: net non-life written premiums per class of business
Figures in millions USD| Class of business | 2016 | 2017 | 2018 | 2019 | 2020 |
|---|---|---|---|---|---|
Agricultural risks | 181 | 1 398 | 1 831 | 1 641 | 1 858 |
Fire | 774 | 928 | 1 204 | 1 156 | 1 361 |
Motor | 677 | 1 021 | 1 237 | 1 200 | 1 255 |
Health | 378 | 626 | 796 | 735 | 737 |
Marine | 129 | 137 | 166 | 204 | 237 |
Aviation | 54 | 89 | 97 | 130 | 161 |
Engineering | 116 | 131 | 149 | 126 | 146 |
Miscellaneous accident (2) | 134 | 268 | 247 | 340 | 327 |
Total non-life | 2 441 | 4 598 | 5 726 | 5 531 | 6 081 |
GIC Re: net non-life earned premiums per class of business
Figures in millions USD| Class of business | 2016 | 2017 | 2018 | 2019 | 2020 |
|---|---|---|---|---|---|
Agricultural risks | 132 | 1 277 | 1 818 | 1 622 | 1 839 |
Fire | 679 | 866 | 1 126 | 1 155 | 1 204 |
Motor | 625 | 862 | 1 328 | 1 194 | 1 149 |
Health | 348 | 509 | 897 | 671 | 770 |
Marine | 142 | 163 | 133 | 175 | 213 |
Aviation | 71 | 73 | 93 | 111 | 138 |
Engineering | 111 | 126 | 138 | 133 | 130 |
Miscellaneous accident (2) | 144 | 204 | 266 | 285 | 317 |
Total non-life | 2 252 | 4 081 | 5 797 | 5 345 | 5 762 |
GIC Re: net non-life incurred losses per class of business
Figures in thousands USD| Class of business | 2016 | 2017 | 2018 | 2019 |
|---|---|---|---|---|
Agricultural risks | 213 | 1 029 | 1 944 | 1 475 |
Fire | 520 | 676 | 982 | 1 192 |
Motor | 588 | 830 | 972 | 1 015 |
Health | 321 | 456 | 630 | 592 |
Marine | 95 | 116 | 41 | 118 |
Aviation | 50 | 67 | 101 | 130 |
Engineering | 35 | 57 | 70 | 82 |
Miscellaneous accident (2) | 97 | 51 | 262 | 159 |
Total non-life | 1 920 | 3 283 | 5 002 | 4 763 |
GIC Re: net non-life management expenses per class of business
Figures in millions USD| Class of business | 2016 | 2017 | 2018 | 2019 |
|---|---|---|---|---|
Agricultural risks | 26 | 157 | 231 | 107 |
Fire | 197 | 265 | 280 | 322 |
Motor | 130 | 181 | 230 | 182 |
Health | 81 | 130 | 172 | 121 |
Marine | 28 | 26 | 34 | 41 |
Aviation | 11 | 15 | 18 | 30 |
Engineering | 32 | 32 | - | 35 |
Miscellaneous accident (2) | 45 | 63 | 47 | 75 |
Total non-life | 552 | 868 | 1 012 | 913 |
(1) Evolution in local currency
(2) Including workmen's compensation, personal accident, third party liability and credit insurance
Exchange rate as at 31/03/2020 : 1 INR = 0.01329 USD ; 31/03/2019 : 1 INR = 0.01437 USD; at 31/03/2018: 1 INR = 0.01537 USD; at 31/03/2017 : 1 INR = 0.01541 USD ; at 31/03/2016 : 1 INR = 0.01508 USD
GIC Re: net non-life loss ratio per class of business
| Class of business | 2016 | 2017 | 2018 | 2019 |
|---|---|---|---|---|
Agricultural risks | 162.16% | 80.60% | 106.94% | 90.94% |
Fire | 76.58% | 78.07% | 87.26% | 103.20% |
Motor | 94.03% | 96.36% | 73.18% | 85.08% |
Health | 92.28% | 89.58% | 70.25% | 88.28% |
Marine | 67.07% | 71.34% | 30.88% | 67.49% |
Aviation | 70.21% | 91.22% | 108.82% | 117.51% |
Engineering | 31.87% | 45.21% | 50.60% | 61.60% |
Miscellaneous accident (1) | 67.05% | 24.74% | 98.60% | 55.60% |
Total non-life | 85.23% | 80.44% | 86.28% | 89.12% |
(1) Including workmen's compensation, personal accident, third party liability and credit insurance
GIC Re: net non-life management expenses ratio per class of business
| Class of business | 2016 | 2017 | 2018 | 2019 |
|---|---|---|---|---|
Agricultural risks | 14.43% | 11.23% | 12.62% | 6.52% |
Fire | 25.47% | 28.50% | 23.21% | 27.80% |
Motor | 19.24% | 17.70% | 18.60% | 15.13% |
Health | 21.58% | 20.79% | 21.63% | 16.52% |
Marine | 22.13% | 18.74% | 20.31% | 19.99% |
Aviation | 21.25% | 17.19% | 18.88% | 22.91% |
Engineering | 27.60% | 24.53% | -0.05% | 28.24% |
Miscellaneous accident (1) | 33.97% | 23.50% | 18.98% | 22.18% |
Total non-life | 22.62% | 18.89% | 17.67% | 16.50% |
(1) Including workmen's compensation, personal accident, third party liability and credit insurance
GIC Re: net non-life combined ratio per class of business
| Class of business | 2016 | 2017 | 2018 | 2019 |
|---|---|---|---|---|
Agricultural risks | 176.59% | 91.83% | 119.56% | 97.46% |
Fire | 102.05% | 106.57% | 110.47% | 131.00% |
Motor | 113.27% | 114.06% | 91.78% | 100.21% |
Health | 113.86% | 110.37% | 91.88% | 104.80% |
Marine | 89.20% | 90.08% | 51.19% | 87.48% |
Aviation | 91.46% | 108.41% | 127.70% | 140.42% |
Engineering | 59.47% | 69.74% | 50.55% | 89.84% |
Miscellaneous accident (1) | 101.02% | 48.24% | 117.58% | 77.78% |
Total non-life | 107.85% | 99.33% | 103.95% | 105.62% |
(1) Including workmen's compensation, personal accident, third party liability and credit insurance
GIC Re: evolution of net ratios
Contact
| Head Office | 170, Jamshedji Tata Road, Churchgate, Mumbai - 400 020, India |
| Phone | +91 22 2286 7000 |
| Fax | +91 22 2288 4010 |
| info [at] gicofindia [dot] com | |
| Website | www.gicofindia.com |