Kenyan insurance market (2016-2020)

Kenyan insurance market features
- Regulatory authority: Insurance Regulatory Authority (IRA)
- Life and non-life premiums: 2.12 billion USD
- Insurance density (2019): 42.4 USD
- Penetration rate (2019): 2.3 %
Structure of the Kenyan insurance market in 2020
| Market stakeholders | Total |
|---|---|
Non-life insurance companies | 35 |
Life insurance companies | 24 |
Reinsurance companies | 5 |
Profile
- Area (1): 580 876 Km2
- Population (1) (2019) : 52 573 973 inhabitants
- GDP (1) (2019) : 95 503 billion USD
- GDP per capita (2019) : 1816 USD
- GDP growth rate (2019) (1): 5.37 %
- Inflation rate (2019) : 5.2%
- Main economic sectors : agriculture (tea, coffee, wheat, corn, sugar cane), aluminium, cement, tourism.
Major cities (2)
(per number of inhabitants in 2016)
- Nairobi (capital) : 7 626 752
- Mombasa : 1 535 899
- Nakuru : 610 637
(1) Source Banque Mondiale
(2) Source : population.data
Kenyan insurance market: evolution of premiums per life and non-life class of business (2016-2020)
Figures in thousands USD| Branches | 2016 | 2017 | 2018 | 2019 | 2020 |
|---|---|---|---|---|---|
Non-life | 1 165 986 | 1 197 884 | 1 244 514 | 1 276 447 | 1 190 611 |
Life | 704 314 | 794 955 | 853 106 | 952 528 | 929 260 |
Total | 1 870 300 | 1 992 839 | 2 097 620 | 2 228 975 | 2 119 871 |
Exchange rate as at 31/12/2020 : 1 KES = 0.00910 USD at 31/12/2019 : 1 KES = 0.00978 USD; at 31/12/2018 : 1 KES = 0.00976 USD ; at 31/12/2017 : 1 KES = 0.0096 USD; at 31/12/2016 : 1 KES = 0.00958 USD
Turnover per class of business: 2016-2020
Figures in thousandsClasses of business | 2016 | 2017 | 2018 | 2019 | 2020 | 2020 shares |
|---|---|---|---|---|---|---|
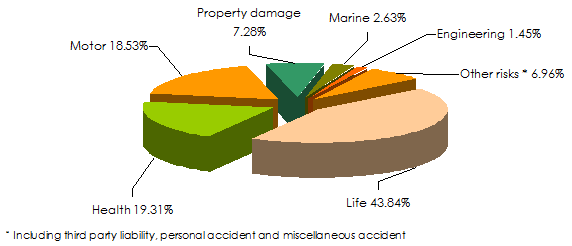
Health | 368 978 | 368 039 | 392 313 | 414 165 | 409 278 | 19.31% |
Motor | 426 176 | 429 228 | 449 826 | 454 581 | 392 775 | 18.53% |
Proprety damage(1) | 146 832 | 158 263 | 158 930 | 160 188 | 154 347 | 7.28% |
Marine(2) | 39 036 | 50 708 | 53 727 | 51 815 | 55 749 | 2.63% |
Engineering | 33 272 | 40 227 | 36 029 | 34 252 | 30 863 | 1.45% |
Third party liability | 24 143 | 27 049 | 26 634 | 30 555 | 29 167 | 1.37% |
Personal accident | 38 342 | 33 756 | 30 815 | 32 116 | 21 149 | 1.00% |
Miscellaneous accident (3) | 89 207 | 90 614 | 96 240 | 98 775 | 97 283 | 4.59% |
Total non-life | 1 165 986 | 1 197 884 | 1 244 514 | 1 276 447 | 1 190 611 | 56.16% |
Life | 704 314 | 794 955 | 853 106 | 952 528 | 929 260 | 43.84% |
Grand total | 1 870 300 | 1 992 839 | 2 097 620 | 2 228 975 | 2 119 871 | 100% |
(1) Including theft and fire
(2) Including aviation and marine transport
(3) Including workmen’s compensation
Turnover 2020 per class of business
Read also | Insurance companies in Kenya
Kenyan insurance market: net loss ratio 2020 per non-life insurer
Figures in thousands| Net incurred losses | Net earned premiums | Net loss ratio | |||
|---|---|---|---|---|---|
| In KES | In USD | In KES | In USD | ||
UAP Insurance | 5 817 527 | 52 939 | 8 931 923 | 81 281 | 65.13% |
CIC General | 6 053 852 | 55 090 | 8 641 914 | 78 641 | 70.05% |
APA Insurance | 4 192 088 | 38 148 | 6 409 283 | 58 324 | 65.41% |
Jubilee Health | 4 122 254 | 37 513 | 6 047 194 | 55 029 | 68.17% |
Britam | 4 042 054 | 36 783 | 6 286 505 | 57 207 | 64.30% |
GA Insurance | 2 230 835 | 20 301 | 3 820 946 | 34 771 | 58.38% |
ICEA Lion General | 1 444 395 | 13 144 | 3 132 038 | 28 502 | 46.12% |
Heritage | 1 610 963 | 14 660 | 3 470 003 | 31 577 | 46.43% |
AAR Insurance | 2 594 960 | 23 614 | 3 751 434 | 34 138 | 69.17% |
Geminia | 2 780 894 | 25 306 | 4 102 480 | 37 333 | 67.79% |
Resolution | 1 234 893 | 11 238 | 1 952 085 | 17 764 | 63.26% |
Madison | 2 615 870 | 23 804 | 3 792 354 | 34 510 | 68.98% |
First Assurance | 1 349 953 | 12 285 | 2 383 070 | 21 686 | 56.65% |
Sanlam | 1 263 550 | 11 498 | 2 117 495 | 19 269 | 59.67% |
Mayfair | 1 079 062 | 9 819 | 1 691 953 | 15 397 | 63.78% |
Jubilee General | 1 666 934 | 15 169 | 2 302 553 | 20 953 | 72.40% |
AIG | 332 832 | 3 029 | 830 507 | 7 558 | 40.08% |
Occidental | 1 571 376 | 14 300 | 2 060 407 | 18 750 | 76.27% |
Directline | 2 133 950 | 19 419 | 2 597 511 | 23 637 | 82.15% |
Kenindia | 1 267 959 | 11 538 | 1 664 308 | 15 145 | 76.19% |
The Kenyan Alliance | 617 579 | 5 620 | 1 311 800 | 11 937 | 47.08% |
Fidelity Shield | 1 174 944 | 10 692 | 1 465 087 | 13 332 | 80.20% |
Saham | 661 097 | 6 016 | 1 039 841 | 9 463 | 63.58% |
The Monarch | 749 953 | 6 825 | 1 359 091 | 12 368 | 55.18% |
Pacis | 549 396 | 4 999 | 1 079 087 | 9 820 | 50.91% |
Kenya Orient | 836 926 | 7 616 | 1 118 037 | 10 174 | 74.86% |
Tausi | 245 216 | 2 231 | 807 666 | 7 350 | 30.36% |
Metropolitan Cannon | 487 091 | 4 432 | 837 343 | 7 620 | 58.17% |
Intra Africa | 621 527 | 5 656 | 1 076 057 | 9 792 | 57.76% |
African Merchant AMACO | 422 791 | 3 847 | 975 131 | 8 874 | 43.36% |
Corporate | 448 973 | 4 086 | 773 066 | 7 035 | 58.08% |
Allianz | 340 317 | 3 097 | 500 012 | 4 550 | 68.06% |
Pioneer | 416 983 | 3 794 | 700 610 | 6 376 | 59.52% |
MUA | 231 602 | 2 108 | 475 742 | 4 329 | 48.68% |
Trident | 151 604 | 1 380 | 671 369 | 6 109 | 22.58% |
Total non-life | 57 362 200 | 521 996 | 90 175 902 | 820 601 | 63.61% |
Net loss ratio = Net incurred losses / Net earned premiums
Kenyan insurance market: management expenses ratio 2020 per non-life insurer
Figures in thousands| Management expenses (1) | Net written premiums | Net management expenses ratio | |||
|---|---|---|---|---|---|
| In KES | In USD | In KES | In USD | ||
UAP Insurance | 2 952 265 | 26 866 | 9 217 600 | 83 880 | 32.03% |
CIC General | 3 063 047 | 27 874 | 8 462 245 | 77 006 | 36.20% |
APA Insurance | 1 978 125 | 18 001 | 6 366 573 | 57 936 | 31.07% |
Jubilee Health | 1 231 390 | 11 206 | 6 657 130 | 60 580 | 18.50% |
Britam | 2 944 189 | 26 792 | 6 691 030 | 60 888 | 44.00% |
GA Insurance | 1 031 986 | 9 391 | 4 078 738 | 37 117 | 25.30% |
ICEA Lion General | 1 302 732 | 11 855 | 3 103 249 | 28 240 | 41.98% |
Heritage | 1 493 295 | 13 589 | 3 415 224 | 31 079 | 43.72% |
AAR Insurance | 1 180 054 | 10 738 | 3 717 275 | 33 827 | 31.75% |
Geminia | 1 273 526 | 11 589 | 4 172 075 | 37 966 | 30.53% |
Resolution | 676 860 | 6 159 | 1 709 811 | 15 559 | 39.59% |
Madison | 1 307 524 | 11 898 | 3 812 769 | 34 696 | 34.29% |
First Assurance | 1 002 450 | 9 122 | 2 584 387 | 23 518 | 38.79% |
Sanlam | 850 559 | 7 740 | 2 442 495 | 22 227 | 34.82% |
Mayfair | 437 208 | 3 979 | 1 668 199 | 15 181 | 26.21% |
Jubilee General | 1 153 180 | 10 494 | 1 762 772 | 16 041 | 65.42% |
AIG | 327 350 | 2 979 | 801 769 | 7 296 | 40.83% |
Occidental | 791 021 | 7 198 | 2 097 792 | 19 090 | 37.71% |
Directline | 1 070 870 | 9 745 | 2 473 134 | 22 506 | 43.30% |
Kenindia | 704 854 | 6 414 | 1 650 245 | 15 017 | 42.71% |
The Kenyan Alliance | 804 095 | 7 317 | 1 437 917 | 13 085 | 55.92% |
Fidelity Shield | 482 376 | 4 390 | 1 317 620 | 11 990 | 36.61% |
(1) Including commissions
Net management expenses ratio = (Management expenses + Net commissions) / Net written premiums
Kenyan insurance market: net combined ratio 2020 per non-life insurer
| Net loss ratio | Net management expenses ratio | Combined ratio | |
|---|---|---|---|
UAP Insurance | 65.13% | 32.03% | 97.16% |
CIC General | 70.05% | 36.20% | 106.25% |
APA Insurance | 65.41% | 31.07% | 96.48% |
Jubilee Health | 68.17% | 18.50% | 86.67% |
Britam | 64.30% | 44.00% | 108.30% |
GA Insurance | 58.38% | 25.30% | 83.68% |
ICEA Lion General | 46.12% | 41.98% | 88.10% |
Heritage | 46.43% | 43.72% | 90.15% |
AAR Insurance | 69.17% | 31.75% | 100.92% |
Geminia | 67.79% | 30.53% | 98.32% |
Resolution | 63.26% | 39.59% | 102.85% |
Madison | 68.98% | 34.29% | 103.27% |
First Assurance | 56.65% | 38.79% | 95.44% |
Sanlam | 59.67% | 34.82% | 94.49% |
Mayfair | 63.78% | 26.21% | 89.99% |
Jubilee General | 72.40% | 65.42% | 137.82% |
AIG | 40.08% | 40.83% | 80.91% |
Occidental | 76.27% | 37.71% | 113.98% |
Directline | 82.15% | 43.30% | 125.45% |
Kenindia | 76.19% | 42.71% | 118.90% |
The Kenyan Alliance | 47.08% | 55.92% | 103.00% |
Fidelity Shield | 80.20% | 36.61% | 116.81% |
Saham | 63.58% | 38.76% | 102.34% |
The Monarch | 55.18% | 45.29% | 100.47% |
Pacis | 50.91% | 48.09% | 99.00% |
Kenya Orient | 74.86% | 50.17% | 125.03% |
Tausi | 30.36% | 50.59% | 80.95% |
Metropolitan Cannon | 58.17% | 49.48% | 107.65% |
Intra Africa | 57.76% | 46.03% | 103.79% |
African Merchant AMACO | 43.36% | 69.42% | 112.78% |
Corporate | 58.08% | 40.51% | 98.59% |
Allianz | 68.06% | 64.95% | 133.01% |
Pioneer | 59.52% | 45.30% | 104.82% |
MUA | 48.68% | 90.49% | 139.17% |
Trident | 22.58% | 64.59% | 87.17% |
Total non-life | 63.61% | 37.29% | 100.9% |
Live coverage
11:51
04/24
04/24
04/24
04/24

Latest news