Kenindia Assurance Company

- Date of creation: 6 December 1978 in Nairobi
- Class of business: Life and non-life
- Subsidiaries:
- Kenya Pravack
- Kenindia Asset Management Company
- Tanzindia Assurance Company
- Number of employees: 236
Kenindia Assurance Company in 2019
 |  |
M. N. Mehta Chairman of the board | B. S. Sharma Managing Director |
Share capital | 5 486 580 USD |
Turnover | 79 026 967 USD |
Assets | 488 007 000 USD |
Shareholder’s equity | 34 362 323 USD |
Net result | -1 862 014 USD |
Net non-life loss ratio | 97.30% |
Net non-life management expenses ratio | 45.41% |
Non-life combined ratio | 142.71% |
Management
| M. N. Mehta | Chairman of the board |
| B. S. Sharma | Managing director |
| J. Macharia | Chief Operating Officer (COO) |
| Mohan Jha | General Manager, Finance |
| V. R. Kumar | General Manager, General Operations |
| Uthup Joseph | General Manager, Life Division |
Shareholding
| Shareholders | Shares |
| Life Insurance Corporation of India | 10.21% |
| General Insurance Corporation of India | 9.19% |
| National Insurance Company | 9.19% |
| New India Assurance Co. | 9.19% |
| United India Insurance Co. | 9.19% |
| Oriental Insurance Company | 9.00% |
| Sansora Investments | 7.90% |
| Chandaria Foundation Registered Trustees | 7.70% |
| Mehta Group | 6.17% |
| Lex Holdings | 4.58% |
| Others | 17.68% |
Read also | Share capital increase for Kenyan insurers
Kenindia Assurance Company: Major technical highlights (2015-2019)
Figures in USD| Highlights | 2015 | 2016 | 2017 | 2018 | 2019 |
|---|---|---|---|---|---|
Gross written premiums | 59 021 290 | 66 513 557 | 73 493 107 | 82 000 455 | 79 026 967 |
Non-life gross written premiums | 27 494 890 | 28 701 297 | 28 939 507 | 27 861 735 | 24 141 607 |
Net written premiums | 47 948 602 | 55 486 383 | 62 651 482 | 72 320 351 | 70 257 134 |
Net non-life written premiums | 16 643 002 | 18 019 003 | 18 491 482 | 18 620 831 | 15 694 514 |
Net non-life earned premiums | 16 000 013 | 17 604 984 | 19 050 854 | 18 792 665 | 17 089 719 |
Net non-life incurred losses | 10 957 046 | 11 893 417 | 12 840 490 | 13 320 809 | 16 627 878 |
Non-life management expenses | 6 090 989 | 6 907 381 | 7 704 173 | 7 664 674 | 7 127 097 |
Net non-life loss ratio (1) | 68.48% | 67.56% | 67.40% | 70.88% | 97.30% |
Net non-life management expenses ratio (2) | 36.60% | 38.33% | 41.66% | 41.16% | 45.41% |
Net non-life combined ratio (3) | 105.08% | 105.89% | 109.06% | 112.04% | 142.71% |
Net result | 7 592 736 | 2 654 235 | 2 354 496 | 3 212 602 | -1 862 014 |
(1) Loss ratio = incurred losses / earned premiums
(2) Management expenses ratio = management expenses / written premiums
(3) Combined ratio = loss ratio + management expenses ratio
Kenindia Assurance Company: Turnover breakdown per class of business (2015-2019)
Figures in USD| 2015 | 2016 | 2017 | 2018 | 2019 | 2019 shares | |
|---|---|---|---|---|---|---|
Motor | 7 680 663 | 8 312 940 | 8 083 651 | 9 082 149 | 7 318 531 | 9.26% |
Fire | 7 116 672 | 7 844 305 | 7 832 170 | 6 204 237 | 5 578 326 | 7.06% |
Personal accident (1) | 3 944 208 | 4 391 261 | 4 507 306 | 4 063 029 | 3 566 913 | 4.51% |
Marine (2) | 2 513 808 | 2 467 626 | 2 674 233 | 2 760 206 | 2 418 770 | 3.06% |
Theft | 2 761 671 | 2 290 942 | 2 294 611 | 1 963 302 | 1 844 753 | 2.34% |
Engineering | 1 897 603 | 1 658 097 | 1 590 605 | 1 653 920 | 1 432 799 | 1.81% |
Health | 968 851 | 1 006 341 | 1 281 062 | 1 342 390 | 1 329 258 | 1.68% |
Third party liability | 377 030 | 491 904 | 437 184 | 553 392 | 482 134 | 0.61% |
Miscellaneous accident | 234 384 | 237 881 | 238 685 | 239 110 | 170 123 | 0.22% |
| Total non-life | 27 494 890 | 28 701 297 | 28 939 507 | 27 861 735 | 24 141 607 | 30.55% |
Retirement benefits funds | 21 494 189 | 24 113 483 | 28 361 203 | 34 931 284 | 34 572 515 | 43.75% |
Ordinary life insurance | 9 611 155 | 9 834 454 | 11 856 739 | 14 133 720 | 15 786 954 | 19.98% |
Annuities | - | 3 291 822 | 3 621 619 | 4 607 315 | 4 034 123 | 5.10% |
Group life insurance | 421 056 | 572 501 | 714 039 | 466 401 | 491 768 | 0.62% |
| Total life | 31 526 400 | 37 812 260 | 44 553 600 | 54 138 720 | 54 885 360 | 69.45% |
| Grand total | 59 021 290 | 66 513 557 | 73 493 107 | 82 000 455 | 79 026 967 | 100% |
(1) Including workmen’s compensation (2) Including aviation and marine transportation
Turnover breakdown per class of business in 2019
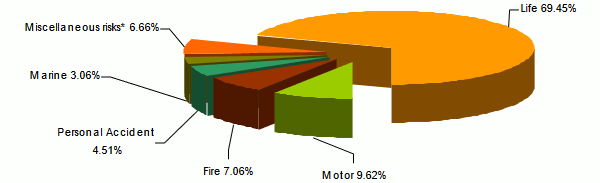
* Including theft, engineering, health and third party liability.
Kenindia Assurance Company: Net written premiums per non-life insurance (2015-2019)
Figures in USD| 2015 | 2016 | 2017 | 2018 | 2019 | 2018-2019 evolution (1) | |
|---|---|---|---|---|---|---|
Motor | 7 367 338 | 7 961 344 | 7 838 093 | 8 829 745 | 7 094 901 | -19.81% |
Fire | 1 331 702 | 1 674 067 | 1 508 314 | 1 133 770 | 896 327 | -21.10% |
Personal accident (2) | 3 358 426 | 4 096 121 | 4 159 642 | 3 732 244 | 3 233 855 | -13.53% |
Marine (3) | 2 108 621 | 1 947 116 | 2 032 262 | 2 185 879 | 1 933 917 | -11.71% |
Theft | 984 749 | 899 897 | 1 048 214 | 852 770 | 767 593 | -10.17% |
Engineering | 283 766 | 128 113 | 297 648 | 258 933 | 236 510 | -8.85% |
Health | 924 730 | 1 006 341 | 1 253 021 | 1 297 758 | 1 296 887 | -0.27% |
Third party liability | 212 544 | 255 623 | 270 240 | 256 239 | 166 045 | -35.33% |
Miscellaneous accident | 71 126 | 50 381 | 84 048 | 73 493 | 68 479 | -7.01% |
| Total non-life | 16 643 002 | 18 019 003 | 18 491 482 | 18 620 831 | 15 694 514 | -15.89% |
(1) Evolution in local currency (2) Including workmen’s compensation (3) Including aviation and marine transportation
Kenindia Assurance Company: Net loss ratio per class of business (2015-2019)
| 2015 | 2016 | 2017 | 2018 | 2019 | |
|---|---|---|---|---|---|
Motor | 69.18% | 66.84% | 58.65% | 67.79% | 119.08% |
Fire | 63.42% | 85.29% | 48.10% | 36.51% | 105.47% |
Personal accident (1) | 76.51% | 76.85% | 92.99% | 118.08% | 70.39% |
Marine (2) | 52.08% | 22.97% | 39.87% | 15.50% | 49.83% |
Theft | 63.39% | 77.71% | 62.13% | 53.60% | 93.72% |
Engineering | 44.31% | 137.22% | 196.27% | 89.27% | 76.79% |
Health | 96.68% | 91.03% | 101.18% | 94.06% | 102.55% |
Third party liability | 49.77% | 58.04% | 56.81% | 36.46% | 181.66% |
Miscellaneous accident | -5.86% | 3.70% | 15.06% | -21.74% | 20.00% |
| Total non-life | 68.48% | 67.56% | 67.40% | 70.88% | 97.30% |
(1) Including workmen’s compensation (2) Including aviation and marine transportation
Kenindia Assurance Company: Net management expenses ratio per class of business (2015-2019)
| 2015 | 2016 | 2017 | 2018 | 2019 | |
|---|---|---|---|---|---|
Motor | 30.46% | 30.12% | 31.89% | 33.55% | 36.25% |
Fire | 66.85% | 79.78% | 101.28% | 91.37% | 127.23% |
Personal accident (1) | 40.43% | 39.45% | 41.68% | 43.78% | 46.35% |
Marine (2) | 39.62% | 38.62% | 43.60% | 44.07% | 45.55% |
Theft | 16.00% | 24.03% | 28.01% | 27.06% | 39.24% |
Engineering | 74.68% | 184.21% | 75.13% | 94.92% | 93.40% |
Health | 28.93% | 28.08% | 30.96% | 33.27% | 35.62% |
Third party liability | 51.63% | 48.33% | 45.74% | 54.18% | 71.36% |
Miscellaneous accident | 23.32% | -104.43% | 33.71% | 29.92% | -98.70% |
| Total non-life | 36.60% | 38.33% | 41.66% | 41.16% | 45.41% |
Kenindia Assurance Company: Net combined ratios per class of business (2015-2019)
| 2015 | 2016 | 2017 | 2018 | 2019 | |
|---|---|---|---|---|---|
Motor | 99.64% | 96.96% | 90.54% | 101.34% | 155.33% |
Fire | 130.27% | 165.07% | 149.38% | 127.88% | 232.70% |
Personal accident (1) | 116.94% | 116.30% | 134.67% | 161.86% | 116.74% |
Marine (2) | 91.70% | 61.59% | 83.47% | 59.57% | 95.38% |
Theft | 79.39% | 101.74% | 90.14% | 80.66% | 132.96% |
Engineering | 118.99% | 321.43% | 271.40% | 184.19% | 170.19% |
Health | 125.61% | 119.11% | 132.14% | 127.33% | 138.17% |
Third party liability | 101.40% | 106.37% | 102.55% | 90.64% | 253.02% |
Miscellaneous accident | 17.46% | -100.73% | 48.77% | 8.18% | -78.70% |
| Total non-life | 105.08% | 105.89% | 109.06% | 112.04% | 142.71% |
(1) Including workmen’s compensation (2) Including aviation and marine transportation
Exchange rate KES/USD as at 31/12 | 2015 | 2016 | 2017 | 2018 | 2019 |
0.0096 | 0.00958 | 0.0096 | 0.00976 | 0.00978 |

Kenindia Assurance Company: Contact
| Head Office | Kenindia House, Loita Street ; PO Box 44372-00100 G.PO, Nairobi, Kenya |
| Phone | +254 (020) 3316099 / 2214439 |
| FAX | +254 (020) 2218380 |
kenindia [at] kenindia [dot] com | |
| Website |