Lloyd’s in light of the Brexit
 Since the failure of political talks between London and Brussels, Lloyd's became resolutely persuaded of a “no deal” outcome, with a Plan B with Brussels as a business center being drawn up.
The branch recently set up in the Belgian capital is overseeing Lloyd’s 19 European branches. It is mainly tasked to ensure due flow of European business previously conducted in London. This makeshift solution is not going to end the financial fears of syndicates that are playing down portfolio losses.
Since January 1, 2019, policies of Lloyd’s European insured have been labelled “Lloyd’s Bruxelles”. These policies, apparently issued by Brussels remain in fact more or less tied to London.
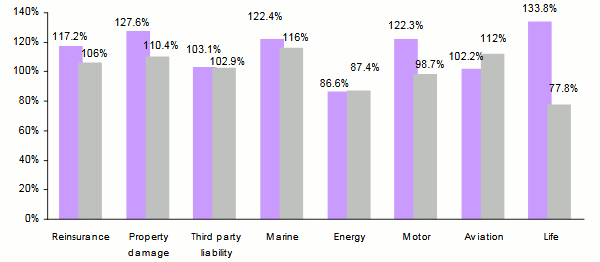
Brexit is not Lloyd’s sole concern, with results reported in recent two years falling below expectations. As is the case for all global markets, the 2017 figures are particularly bad, with a global combined ratio of 114% and class-based peaks of 127.6% in property, 117.2% in reinsurance, 122.9%in motor and 122.4% in marine insurance. Despite the slight improvement, 2018 remains equally bad with a combined ratio of 104.5% and negative results for property, marine and reinsurance classes of business.
In order to meet these losses of 3 billion GBP (4 billion USD) cumulated between 2017 and 2018, Lloyd’s has devised a recovery plan that includes among others review or termination of 10% of most loss-making businesses.
The other flagship measure of the recovery plan pertains to the overhaul of the entire processes of acceptance, risk management, which will end up in digital generalization.
Read also | Lloyd’s: Results 2018
Lloyd’s combined ratios per class of business
Lloyd’s turnover per class of business in %
| Class of business | Share |
|---|---|
Reinsurance | 31% |
Property damage | 27% |
Third party liability | 26% |
Marine | 7% |
Energy | 4% |
Motor | 3% |
Aviation | 2% |
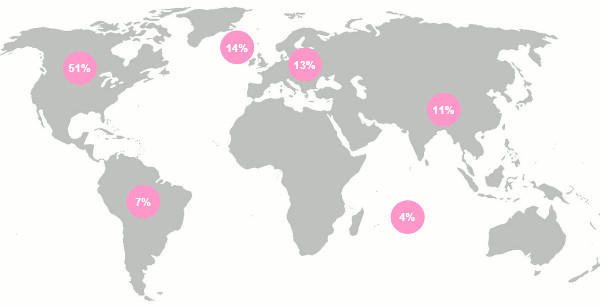
Breakdown of Lloyd’s turnover per region
| Region | Share |
|---|---|
United States and Canada | 51% |
Central and South America | 7% |
United Kingdom | 14% |
Rest of Europe | 13% |
Central Asia and Asia Pacific | 11% |
Rest of the world | 4% |
Lloyd’s: Turnover breakdown per class of business and per region
| Class of business | United States and Canada | Central and South America | United Kingdom | Reste of Europe | Central Asia and Asia Pacific | Rest of the world |
|---|---|---|---|---|---|---|
Reinsurance | 22% | 67% | 31% | 30% | 43% | 63% |
Property damage | 36% | 9% | 26% | 19% | 19% | 9% |
Third party liability | 28% | 14% | 25% | 26% | 28% | 11% |
Marine | 6% | - | 6% | 16% | 6% | 6% |
Energy | 5% | - | 2% | 4% | 2% | 4% |
Motor | 2% | - | 9% | 2% | 1% | 3% |
Aviation | 1% | - | 1% | 3% | 1% | 4% |
Read also | Ranking of top 20 Lloyd's syndicates
