Mauritius insurance market

Mauritius insurance market features
- Regulatory authority: Financial Services Commission
- Life and non-life premiums (2019): 516 million USD
- Insurance density (2019): 408 USD
- Penetration rate (2019): 3.68 %
Mauritius’ insurance market structure in 2019
| Market stakeholders | Total |
|---|---|
Non-life insurance companies | 15 |
Life insurance companies | 9 |
Insurance brokers | 37 |
Insurance agents | 227 |
Total | 288 |
Identity
- Area (2): 2 040 Km2
- Population (1) (2019) : 1 265 711 inhabitants
- GDP (1) (2019): 14.048 billion USD
- GDP per capita (2019): 11 099 USD
- GDP growth rate (1) (2019) : 3.01 %
- Inflation rate (1) (2019) : 0.4%
- Inflation rate: Food industry (sugar), textile, tourism and services.
Main cities (2)
(per number of inhabitants) (2016)
- Port Louis (capital): 148 465
- Vacoas-Phoenix: 106 163
- Beau Bassin-Rose Hill: 104 425
(1) Source : World Bank
(2) Source : population.data
Read also | Ranking of insurers in Mauritius
Mauritius insurance market: evolution of premiums 2015-2019
Figures in thousands USD
| 2015 | 2016 | 2017 | 2018 | 2019 | |
|---|---|---|---|---|---|
Non-life | 204 568 | 217 271 | 257 753 | 265 840 | 273 366 |
Life | 251 710 | 259 769 | 300 550 | 361 065 | 242 470 |
| Total | 456 278 | 477 040 | 558 303 | 626 905 | 515 836 |
Mauritius insurance market: turnover per class of business 2015-2019
Figures in thousands USD
| Classes of business | 2015 | 2016 | 2017 | 2018 | 2019 | Part 2019 |
|---|---|---|---|---|---|---|
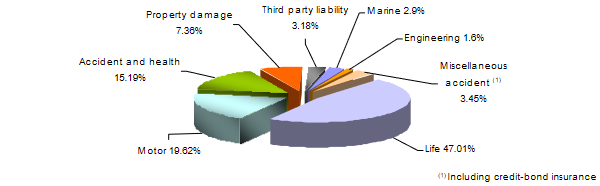
Motor | 78 862 | 82 240 | 96 264 | 99 439 | 101 189 | 19.62% |
Health and accident | 49 683 | 59 404 | 71 430 | 74 534 | 78 362 | 15.19% |
Property damage | 33 801 | 31 477 | 37 350 | 38 352 | 37 995 | 7.36% |
Third party liability | 13 041 | 14 534 | 20 709 | 15 530 | 16 402 | 3.18% |
Marine | 10 822 | 10 782 | 10 911 | 13 011 | 13 388 | 2.59% |
Engineering | 7 252 | 7 156 | 7 430 | 9 246 | 8 263 | 1.60% |
Credit-bond | 2 248 | 1 782 | 1 484 | 1 901 | 2 052 | 0.40% |
Miscellaneous accident | 8 859 | 9 896 | 12 175 | 13 827 | 15 715 | 3.05% |
| Total non-life | 204 568 | 217 271 | 257 753 | 265 840 | 273 366 | 52.99% |
| Total life | 251 710 | 259 769 | 300 550 | 361 065 | 242 470 | 47.01% |
| Grand total | 456 278 | 477 040 | 558 303 | 626 905 | 515 836 | 100% |
2019 turnover per class of business
Mauritius insurance market: 2019 net loss ratio per non-life insurance
Figures in thousands
| Net incurred losses | Net earned premiums | Net loss ratio | |||
|---|---|---|---|---|---|
| In MUR | In USD | In MUR | In USD | ||
Motor | 2 452 035 | 65 126 | 3 492 477 | 92 760 | 70.21% |
Health and accident | 1 198 555 | 31 834 | 1 675 505 | 44 501 | 71.53% |
Property damage | 125 677 | 3 338 | 384 155 | 10 203 | 32.72% |
Third party liability | 67 170 | 1 784 | 187 407 | 4 978 | 35.84% |
Marine | 65 378 | 1 736 | 200 259 | 5 319 | 32.65% |
Engineering | 37 410 | 994 | 64 764 | 1 720 | 57.76% |
Credit-bond | 20 390 | 541 | 19 304 | 513 | 105.63% |
Miscellaneous accident | 42 588 | 1 131 | 283 648 | 7 534 | 15.01% |
| Total non-life | 4 009 203 | 106 484 | 6 307 519 | 167 528 | 63.56% |
Exchange as at MUR/USD au 31/12 | 2015 | 2016 | 2017 | 2018 | 2019 |
0.02704 | 0.02672 | 0.02882 | 0.02835 | 0.02656 |
Read also | Mauritius insurance companies: technical ratios
Live coverage
04/19
04/19
04/19
04/19
04/18

Latest news