Moroccan insurance market in 2018: Top insurance companies and results
Moroccan insurance market in 2018: ranking of insurance companies per turnover
Figures in thousands
| Turnover 2018 | Turnover 2017 | 2017-2018 (1) evolution | 2018 market shares | |||
|---|---|---|---|---|---|---|
| In MAD | In USD | In MAD | In USD | |||
Wafa Assurance | 8 371 000 | 878 202 | 8 049 900 | 862 869 | 3.99% | 20.25% |
RMA | 6 543 700 | 686 500 | 6 224 200 | 667 172 | 5.13% | 15.83% |
Saham Assurance | 5 223 200 | 547 966 | 4 846 000 | 519 443 | 7.78% | 12.63% |
Mutuelle Taamine Chaabi | 4 253 000 | 446 182 | 3 888 500 | 416 808 | 9.37% | 10.29% |
Axa Assurance | 4 231 100 | 443 885 | 4 111 200 | 440 680 | 2.92% | 10.23% |
Atlanta | 2 432 900 | 255 236 | 2 271 100 | 243 439 | 7.12% | 5.88% |
Sanad | 2 022 400 | 212 170 | 1 920 800 | 205 891 | 5.29% | 4.89% |
Marocaine Vie | 1 825 400 | 191 503 | 1 723 400 | 184 731 | 5.92% | 4.42% |
MCMA | 1 418 500 | 148 815 | 1 269 200 | 136 046 | 11.76% | 3.43% |
Allianz Assurance Maroc | 1 367 100 | 143 422 | 1 245 900 | 133 548 | 9.73% | 3.30% |
MAMDA | 1 000 700 | 104 983 | 928 900 | 99 569 | 7.73% | 2.42% |
CAT | 688 800 | 72 262 | 670 100 | 71 828 | 2.79% | 1.67% |
Saham Assistance | 555 000 | 58 225 | 500 300 | 53 627 | 10.93% | 1.34% |
Maroc Assistance internationale | 541 700 | 56 830 | 448 800 | 48 107 | 20.70% | 1.31% |
MATU | 317 600 | 33 319 | 323 200 | 34 644 | -1.73% | 0.77% |
Wafa IMA Assistance | 268 400 | 28 158 | 244 200 | 26 176 | 9.91% | 0.65% |
Euler Hermes ACMAR | 131 700 | 13 817 | 125 800 | 13 485 | 4.69% | 0.32% |
Axa Assistance | 97 800 | 10 260 | 119 600 | 12 820 | -18.23% | 0.24% |
Coface | 55 200 | 5 791 | 55 500 | 5 949 | -0.54% | 0.13% |
| Total | 41 345 200 | 4 337 525 | 38 966 600 | 4 176 830 | 6.10% | 100% |
(1) Variation in local currency
Read also | Results 2018 of the Moroccan insurance market
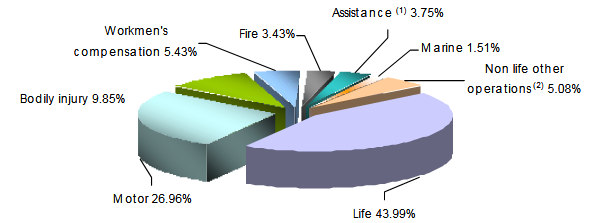
Moroccan insurance market: Turnover per class of business (2017-2018)
Figures in thousands| Turnover 2018 | Turnover 2017 | 2017-2018 (1) evolution | 2018 market shares | |||
|---|---|---|---|---|---|---|
| In MAD | In USD | In MAD | In USD | |||
Motor | 11 147 200 | 1 169 453 | 10 527 000 | 1 128 389 | 5.89% | 26.96% |
Bodily injury | 4 074 300 | 427 435 | 3 922 500 | 420 453 | 3.87% | 9.85% |
Workmen's compensation | 2 244 300 | 235 450 | 2 223 000 | 238 283 | 0.96% | 5.43% |
Fire | 1 417 700 | 148 731 | 1 331 700 | 142 745 | 6.46% | 3.43% |
Assistance, credit, bond | 1 549 100 | 162 516 | 1 415 100 | 151 685 | 9.47% | 3.75% |
Marine | 625 500 | 65 621 | 604 900 | 64 839 | 3.41% | 1.51% |
Other non-life operations | 1 002 100 | 105 130 | 979 400 | 104 982 | 2.32% | 2.42% |
General third party liability | 581 700 | 61 026 | 549 000 | 58 847 | 5.96% | 1.41% |
Technical risks | 300 600 | 31 536 | 242 400 | 25 983 | 24.01% | 0.73% |
Reinsurance acceptances | 213 300 | 22 377 | 186 500 | 19 991 | 14.37% | 0.52% |
Total non-life | 23 155 800 | 2 429 275 | 21 981 500 | 2 356 197 | 5.34% | 56.01% |
Life insurance and capitalisation | 18 189 400 | 1 908 250 | 16 985 100 | 1 820 634 | 7.09% | 43.99% |
| Total | 41 345 200 | 4 337 525 | 38 966 600 | 4 176 831 | 6.10% | 100% |
(1) Growth rate in local currency
(1) Including credit and bond
(2) Including general third party liability, technical risks and reinsurance acceptances
Exchange rate MAD/USD as at 31/12 | 2017 | 2018 |
0.10719 | 0.10491 |
Read also | Maghreb insurance industry: 2017 ranking of companies