North Africa: evolution of the penetration rate and insurance density per country
North Africa: GDP 2014-2018
In million USD| Country | 2014 | 2015 | 2016 | 2017 | 2018 |
|---|---|---|---|---|---|
Egypt | 305 530 | 332 698 | 332 928 | 235 369 | 250 895 |
Algeria | 213 809 | 165 978 | 160 033 | 167 390 | 173 758 |
Morocco | 110 081 | 101 180 | 103 312 | 109 714 | 117 921 |
Tunisia | 47 632 | 43 173 | 41 803 | 39 813 | 39 871 |
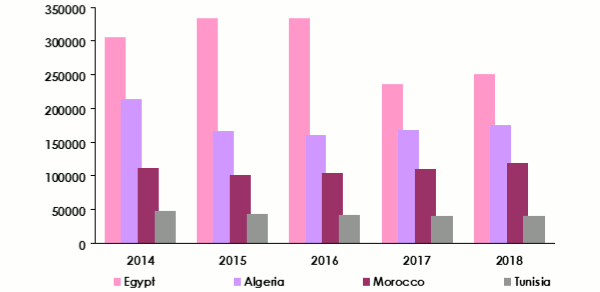
* Source : World Bank
North Africa: Evolution of the population (2014-2018)
| Country | 2014 | 2015 | 2016 | 2017 | 2018 |
|---|---|---|---|---|---|
Egypt | 90 424 654 | 92 442 547 | 94 447 072 | 96 442 593 | 98 423 595 |
Algeria | 38 923 687 | 39 728 025 | 40 551 404 | 41 389 198 | 42 228 429 |
Morocco | 34 192 347 | 34 663 603 | 35 126 296 | 35 581 294 | 36 029 138 |
Tunisia | 11 063 201 | 11 179 949 | 11 303 946 | 11 433 443 | 11 565 204 |
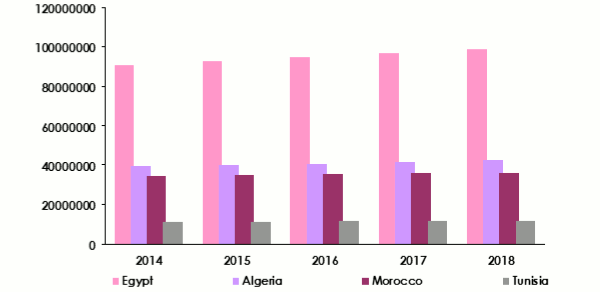
* Source : World Bank
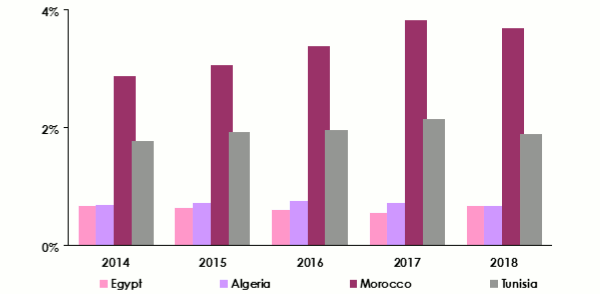
North Africa: Insurance penetration rate (2014-2018)
| Country | 2014 | 2015 | 2016 | 2017 | 2018 |
|---|---|---|---|---|---|
Morocco | 2,85% | 3,05% | 3,37% | 3,81% | 3,68% |
Tunisia | 1,76% | 1,92% | 1,94% | 2,14% | 1,88% |
Algeria | 0,67% | 0,72% | 0,74% | 0,70% | 0,66% |
Egypt | 0,66% | 0,63% | 0,59% | 0,53% | 0,66% |
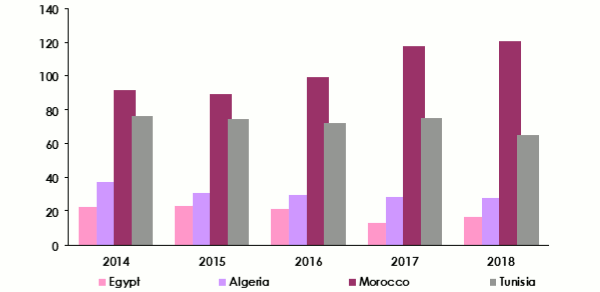
North Africa: Evolution of insurance density (2014-2018)
In USD| Country | 2014 | 2015 | 2016 | 2017 | 2018 |
|---|---|---|---|---|---|
Morocco | 91,78 | 89,15 | 99,25 | 117,39 | 120,39 |
Tunisia | 75,69 | 74,28 | 71,69 | 74,56 | 64,71 |
Algeria | 36,89 | 30,20 | 29,04 | 28,20 | 27,30 |
Egypt | 22,15 | 22,80 | 20,82 | 12,90 | 16,74 |
Read also | North African insurance industry