Oman 2008
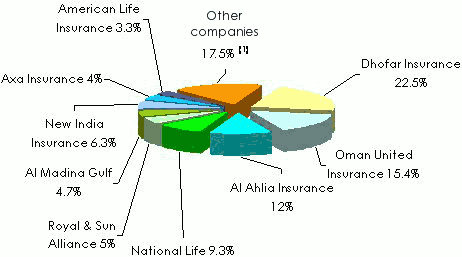
Direct premiums per company and per class of business in 2008
in USD| Motor | Property damage | Marine | Others | Non life total | Life | Grand total | Share (%) | 2007/08 growth | |
|---|---|---|---|---|---|---|---|---|---|
| National companies | |||||||||
Dhofar Insurance | 56 085 140 | 31 687 047 | 13 516 960 | 13 768 232 | 115 057 379 | 7 275 004 | 122 332 383 | 22.5 | 2.9% |
Oman United Ins | 39 368 032 | 3 478 210 | 4 846 225 | 8 494 485 | 56 186 952 | 27 714 560 | 83 901 512 | 15.4 | 23.8% |
Al Ahlia Ins | 33 357 295 | 9 324 247 | 6 986 832 | 14 451 048 | 64 119 422 | 1 330 219 | 65 449 641 | 12.0 | 48.5% |
National Life Ins | 15 895 379 | 154 118 | 26 348 | 557 830 | 16 633 675 | 33 964 666 | 50 598 341 | 9.3 | 96.3% |
Royal & Sun Alliance | 11 072 990 | 11 046 284 | 3 468 204 | 1 591 081 | 27 178 559 | - | 27 178 559 | 5.0 | 4.2% |
Al Madina Gulf Ins | 16 456 728 | 3 730 754 | 493 473 | 3 956 890 | 24 637 845 | 1 198 217 | 25 836 062 | 4.7 | 167.1% |
Oman & Qatar Ins | 9 375 858 | 4 483 962 | 822 741 | 1 133 941 | 15 816 502 | - | 15 816 502 | 2.9 | 5.2% |
Muscat Ins | 2 860 880 | 8 985 909 | 1 399 673 | 2 043 014 | 15 289 476 | - | 15 289 476 | 2.8 | 0.7% |
Muscat Life Ins | - | - | - | - | - | 14 115 970 | 14 115 970 | 2.6 | 30.1% |
Falcon Insurance | 3 986 540 | 3 731 849 | 1 119 805 | 4 292 139 | 13 130 333 | 77 416 | 13 207 749 | 2.4 | -9.5% |
Vision Insurance | 6 339 102 | 485 022 | 53 151 | 1 714 948 | 8 592 223 | - | 8 592 223 | 1.6 | 0% |
Total | 194 797 944 | 77 107 402 | 32 733 412 | 52 003 608 | 356 642 366 | 85 676 052 | 442 318 418 | 81.2 | 27.1% |
Foreign companies | |||||||||
New India Assurance | 18 162 998 | 2 502 663 | 4 590 089 | 9 089 098 | 34 344 848 | - | 34 344 848 | 6.3 | 21.9% |
Axa Insurance | 8 532 245 | 2 532 064 | 2 699 526 | 6 129 914 | 19 893 749 | 1 822 727 | 21 716 476 | 4.0 | 31.5% |
American Life Insurance | - | - 1 623 | - | 1 875 131 | 1 873 508 | 15 896 532 | 17 770 040 | 3.3 | -13.8% |
Arabia Insurance | 10 354 149 | 490 326 | 1 048 098 | 2 576 043 | 14 468 616 | 854 696 | 15 323 312 | 2.8 | 31.6% |
AIG Memsa For Insurance | - | 308 291 | - | 5 795 591 | 6 103 882 | - | 6 103 882 | 1.1 | 0% |
Life Insurance Corp Inter | - | - | - | - | - | 3 202 132 | 3 202 132 | 0.6 | 32.1% |
Al Nisr Insurance | 2 215 539 | 70 241 | 121 486 | 704 786 | 3 112 052 | - | 3 112 052 | 0.6 | 1.2% |
Iran Insurance | 15 987 | 480 918 | 30 828 | 13 263 | 540 996 | - | 540 996 | 0.1 | 12.4% |
Total | 39 280 918 | 6 382 880 | 8 490 027 | 26 183 826 | 80 337 651 | 21 776 087 | 102 113 738 | 18.8 | 23.1% |
Grand total | 234 078 862 | 83 490 282 | 41 223 439 | 78 187 434 | 436 980 017 | 107 452 139 | 544 432 156 | 100 | 26.4% |
Market shares per company in 2008
 1 10 companies
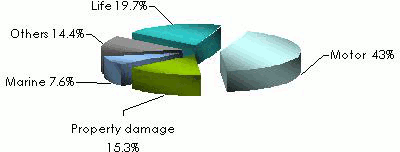
 Breakdown per class of business: 2007-2008
in USD| Premiums 2008 | Shares 2008 | Premiums 2007 | Shares 2007 | |
|---|---|---|---|---|
| Non life | ||||
Motor | 234 078 862 | 43% | 167 829 435 | 38.9% |
Property damage | 83 490 282 | 15.3% | 80 877 824 | 18.8% |
Marine | 41 223 439 | 7.6% | 31 150 981 | 7.2% |
Others | 78 187 434 | 14.4% | 68 415 547 | 15.9% |
Non life total | 436 980 017 | 80.3% | 348 273 787 | 80.8% |
| Life | ||||
Life | 107 452 139 | 19.7% | 82 595 169 | 19.2% |
Grand total | 544 432 156 | 100% | 430 868 956 | 100% |
Market shares per class of business in 2008
Exchange rate OMR/USD as at 31/12 | 2007 | 2008 |
0.38359 | 0.38257 |

Live coverage
04/19
04/19
04/19
04/19
04/18

Latest news