Pension funds: impact of the economic environment and the aging of the population
The population ageing also seems to have an effect on the financial balance of these players.
Pension funds and economic slowdown
 |
The sluggish economic environment has a direct impact on the activity of pension funds. In an effort to offset the decline in profits, these institutions are increasingly taking risks by indulging in short-term speculative investments at the detriment of more secure public bonds.
In the United States, non-risk bonds accounted for 96% of pension fund investments in the 1950s. This rate declined to 50% in the 1990s. Today, it is estimated at 27%(2).
According to the US think tank Hoover Institution, the funding gap for public sector pension schemes have reached in some countries of the Union 3 850 billion USD (3) by the end of 2015. In 2016, this figure was compounded by an additional 434 billion USD. The study points out that, like the subprime crisis, the accumulation of deficits could plunge the country in trouble again.
This situation did not go unnoticed by rating agencies which are starting to sound the alarm. Several US states such as New Jersey and major cities namely Chicago, Houston and Dallas have seen their ratings deteriorate due to the low funding of their pension funds.
(1) www.willistowerswatson.com/fr-FR/press/2016/09/Top-pension-fund-assets-fall-for-the-first-time-since-the-global-financial-crisis
(2)(3) www.lesechos.fr/18/05/2017/lesechos.fr/0212105818247_fonds-de-pension---la-nouvelle-crise-qui-menace-les-etats-unis.htm
Pension funds and ageing population
Like pension plans on a pay-as-you-go basis, pension funds are also affected by demographic change.
The evolution of science, the improvement of medical treatment and the awareness of risk behaviors have significantly contributed to the extension of human life. Today, people live longer, even in the poorest countries.
 |
According to the latest figures from the World Health Organization(1) , life expectancy at birth increased by five years between 2000 and 2015, the fastest increase since the 1960s. However, inequalities persist among the countries. It is in Japan that people live the longest with an average duration of 83.7 years(2). At the other end of the scale, the population of Sierra Leone has the lowest life expectancy with an average duration of 50.1 years.
Global population aged 65 and over rose from 5% in 1960 to 8.5% in 2016(3). This rate varies from country to country reaching 26.6% in Japan. This upward trend is poised to increase in the years to come, creating a strong demand for pensions.
In a report published at the end of September 2015(4), the World Health Organization estimates that the number of people over 60 is likely to double by 2050.
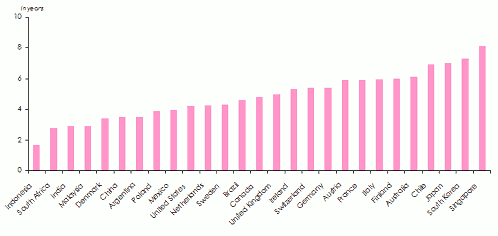
Improvement of life expectancy at age 65 (1975-2015)
 Source : Melbourne Mercer Global Pension Index- Impact of aging population (1) www.who.int/mediacentre/news/releases/2016/health-inequalities-persist/en/
(2) www.who.int/gho/publications/world_health_statistics/2016/EN_WHS2016_AnnexB.pdf?ua=1(page 4)
(3)World Bank data
(4) http://www.who.int/mediacentre/news/releases/2015/older-persons-day/en/
As shown in graph(1), life expectancy at age 65 has increased considerably over the past 40 years in the 27 emerging and developed countries mentioned above. In Indonesia, there has been an improvement of 1.7 years, while in Singapore there has been an increase of 8.1 years. Life expectancy at age 65 is set to increase by another four years during the 2015-2055 period.
Faced with this situation, the future of pension systems, whether social security schemes or private pension funds, is more worrying than ever. The rapid aging of the population is likely to strain the financial balance of these organizations. Moreover, the decline in the fertility rate will only compound the misery of an already alarming situation.
(1) Graph published in a study by the Mercer consultancy firm "Impact of Aging Population", published in October 2016 www.mercer.com/content/dam/mercer/attachments/global/Retirement/gl-2016-mmgpi-impact-ageing-populations-full-report.pdf
The impact of the financial crisis on pension funds
The economic problems associated with the new demographic data could, in the years to come, compromise the income of future retirees, in particular those having underwritten the defined contribution plans. The impact of the crisis on this pension system depends mainly on the age of the contractor. Asset depreciation will affect workers close to retirement age who may sustain large losses with a strong likelihood of their income falling down.
Pension funds’economic weight
According to a study by Willis Towers Watson (1) , pension funds’ assets in the 22 largest global markets rose by 4.3% in 2016 at 36 437 billion USD. Set at 23 721 billion USD in 2006, these assets have grown by 53.6% over the last ten years, reaching their 2016 level.
With 61.7% of total assets, the United States remains the largest market for pension funds. The United Kingdom and Japan have a share of 7.9% and 7.7% respectively. These three countries alone account for more than 77% of total global assets.
World's pension funds in 2016
| Country | Total assets in 2016 (In billion USD) | % of GDP |
|---|---|---|
United States | 22 480 | 121.10% |
United Kingdom | 2 868 | 108.20% |
Japan | 2 808 | 59.40% |
Australia | 1 583 | 126% |
Canada | 1 575 | 102.80% |
Netherlands | 1 296 | 168.30% |
Switzerland | 817 | 123.30% |
South Korea | 575 | 40.90% |
Germany | 415 | 11.90% |
Brazil | 251 | 14.20% |
South Africa | 207 | 73.80% |
Finland | 199 | 83.20% |
Malaysia | 190 | 62.70% |
Chile | 172 | 73% |
Mexico | 154 | 14.50% |
Italy | 153 | 8.20% |
France | 146 | 5.90% |
China | 141 | 1.20% |
Hong Kong | 133 | 42% |
Ireland | 130 | 42.20% |
India | 105 | 4.70% |
Spain | 39 | 3.10% |
Total | 36 437 | 62% |
www.next-finance.net/IMG/pdf/global-pensions-asset-study-2017.pdf
The total pension fund assets of the aforementioned markets in the table above account for 62% of the cumulative GDP of these countries.
The capital held by these financial institutions exceeds the national GDP in several countries. This is the case in the United States, the United Kingdom, Switzerland, Australia, Canada and the Netherlands, where the ratio of these two indicators is 168.3% for the latter country.
Given the size of the funds they manage, pension funds have become key players in the financial markets.
Although the assets of the 22 largest markets increased significantly during the decade between 2006 and 2016, those of the world's 300 largest pension funds went down by 3.4% in 2015(1). This last year marks the first decline since the 2008 financial crisis due to the decline in interest rates which make it difficult to achieve satisfactory returns.
Top 20 largest pension funds in the World in 2015
in millions USD
| Ranking | Fund name | Countries | Assets | Defined benefit | Defined contribution |
|---|---|---|---|---|---|
| 1 | Government Pension Investment | Japan | 1163 203 | 1163 203 | - |
| 2 | Government Pension Fund | Norway | 865 943 | - | - |
| 3 | Federal Retirement Thrift | United States | 443 328 | - | 443 328 |
| 4 | National Pension | South Korea | 435 405 | 435 405 | - |
| 5 | ABP | Netherlands | 384 271 | 384 271 | - |
| 6 | National Social Security | China | 294 939 | - | - |
| 7 | California Public Employees | United States | 285 774 | 283 879 | 1 895 |
| 8 | Central Provident Fund | Singapore | 211 373 | - | 211 373 |
| 9 | Canada Pension | Canada | 201 871 | 201 871 | - |
| 10 | PFZW | Netherlands | 186 471 | 186 471 | - |
| 11 | California State Teachers | United States | 181 875 | 181 294 | 581 |
| 12 | Local Government Officials | Japan | 176 160 | 176 160 | - |
| 13 | New York State Common | United States | 173 541 | 173 541 | - |
| 14 | Employees Provident Fund | Malaysia | 161 707 | - | 161 707 |
| 15 | New York City Retirement | United States | 155 120 | 155 120 | - |
| 16 | Florida State Board | United States | 147 819 | 139 231 | 8 588 |
| 17 | Texas Teachers | United States | 125 327 | 125 327 | - |
| 18 | Ontario Teachers | Canada | 123 985 | 123 985 | - |
| 19 | ATP | Denmark | 106 640 | - | 106 640 |
| 20 | GEPF | South Africa | 103 147 | 103 147 | - |
Source : Willis Towers Watson