Reinsurance of natural catastrophes
Mathematical and statistical models contribute nowadays to better appreciate risk and, thus, minimize any wrong estimation.
The increase in the number of natural catastrophes
 In 2011, Northern Japan was devastated by a chain of natural catastrophes of unprecedented scale. The earthquake, of magnitude 9 on the Richter scale and the Tsunami that ensued with tidal waves reaching 40 meters in height, caused huge human losses. Economic losses amounted to 210 billion USD, 35 to 40 billion USD of which have been supported by the insurance industry and 12 to 14 billion USD by reinsurers. Despite the scale of the damage, the insurers and reinsurers involved managed to honor their obligations thanks to their financial reserves and to their high capitalization. This was not always the case with the 1992 hurricane Andrew which seriously strained the insurance market to its limit. Even though insured losses, then, amounted to only 20 billion USD, a large number of insurers and reinsurers found it difficult to indemnify their customers.
A catastrophic loss is defined as the sum of all losses caused by a same single event or as the sum of losses attributable to the same cause or causal chain. Given the considerable number of affected policies, loss estimates for an insurer remains quite complicated. Moreover, the frequency of such an event may be very high.
Despite technological improvements in the construction field, a remarkable increase in the number of natural catastrophes and the claims incurred has been noted worldwide.
A clear trend is being set for the last thirty years. The scale of the damage has been accounted for by the increase in insurance penetration rate in risky zones, by population growth and by the leap of insured values. Furthermore, human activity is now seriously blamed for rising temperatures which led to a change in water cycle, with the number of cyclones, floods and torrential rains poised to increase in the future.
Breakdown per continent of the 820 catastrophic events that occured in 2011
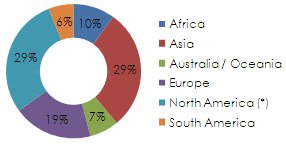 * Including Central America and Caribbean Sources: NatCatSERVICE, Munich Re
The areas with high loss potential and types of cover
 Reinsurers pay special attention to their exposure to natural catastrophe events in Japan, United States (earthquakes, tsunamis, cyclones) and in Northern Europe (storms, floods) where insured sums and human density are particularly high. Given the major stakes in these regions, modeling tools for accumulation control are particularly detailed in these zones.
The heavy floods sustained by Thailand in 2011 and the devastating 2010 earthquake in Chile have, nonetheless, shown that non-modelized countries, deemed then as less exposed may trigger record-high losses. Following these events, many reinsurers have reviewed their underwriting policy in countries with inadequate or inexistent modeling tools, hence, the trend toward lighter liabilities by reinsurers in these regions.
Number of natural catastrophes worldwide: 1980-2011
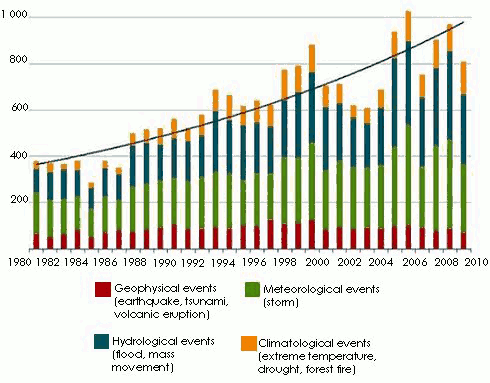 Source: NatCatSERVICE, Munich Re
 Top 20 of insured losses: 1970-2011
in millions USD| Overall loss1 | Event | Country | |
|---|---|---|---|
25 August 2005 | 74 700 | Hurricane Katrina | USA, Caribbean |
11 March 2011 | 35 000 2 | Earthquake and tsunami | Japan |
23 August 1992 | 25 600 | Hurricane Andrew | USA, Bahamas |
17 January 1994 | 21 200 | Earthquake | USA |
6 September 2008 | 21 100 | Hurricane Ike | USA, Caribbean |
27 July 2011 | 15 000-20 000 2 | Floods | Thaïland |
2 September 2004 | 15 400 | Hurricane Ivan | USA, Caribbean |
19 October 2005 | 14 500 | Hurricane Wilma | USA, Caribbean, Mexico |
22 February 2011 | 14 000 2 | Earthquake | New Zeland |
20 September 2005 | 11 600 | Hurricane Rita | USA, Cuba |
11 August 2004 | 9 600 | Hurricane Charley | USA, Caribbean, Cuba |
27 September 1991 | 9 300 | Typhoon Mireille | Japan |
15 September 1989 | 8 300 | Hurricane Hugo | USA, Puerto Rico |
27 February 2010 | 8 200 | Earthquake and tsunami | Chile |
25 January 1990 | 8 000 | Windstorm Daria | Europe |
25 December 1999 | 7 800 | Windstorm Lothar | Europe |
22 April 2011 | 7 300 | Windstorm and tornadoes | USA |
20 May 2011 | 7 000 | Windstorm and tornadoes | USA |
18 January 2007 | 6 600 | Windstorm Kyrill | Europe |
15 October 1987 | 6 100 | Windstorm and floods | Europe |
The reinsurer’s liability
The reinsurer commits himself to indemnify an insurer upon the occurrence of a loss defined by the contracting parties in return for a premium payment. For each treaty exposed to natural catastrophes, the reinsurer has to accurately assess risk in order to define a rate which would enable him to honor his engagements, hence the crucial importance of the mutualization of risks.
To calculate the premium, the reinsurer estimates the average annual loss and takes into account possible maximum loss resulting from a large-scale event and of a very high frequency. These data will be calculated according to the frequency of loss occurrence, the scale of the events and the monitoring of accumulation.
Loss occurrence frequency
Loss occurrence frequency for a fire portfolio exposed to natural perils is relatively low. This portfolio is unlikely to be affected by a natural event. Earthquakes, for instance, especially those with high magnitude, have an occurrence frequency which could stretch from a decade to several centuries, which means that the incurred loss of a given treaty may be subject to fluctuation. Loss experience is rarely sufficient to allow an annual loss estimate. Observations, therefore, must be coupled with statistical and modeling tools.
Events amplitude
Due to the important number of variables, estimating the loss triggered by natural catastrophes is complex. the current modeling tools used for the wide areas with their exposure to risks (floods, storms, earthquakes, hail storms), buildings resilience as well as the kind of uses of insured properties are the elements which will make it possible to estimate the scale of the damage that may extend over thousands of square kilometers.
The monitoring of accumulation
For a reinsurer, the geographical position of insured values is essential. According to the covered region, a given portfolio is more vulnerable to a kind of catastrophe than to any other one. A reinsurer grants particular attention to the risk of geographic dependence. It is, therefore, crucial for him to know the location of insurance density per type of construction (simple, industrial, commercial, content risks,...) in order to determine his exposure.
Overall losses and insured losses: 1980-2011
in billions USD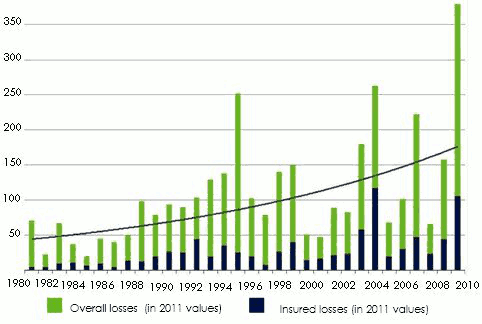 Source: NatCatSERVICE, Munich Re
 Risk assessment models
In addition to the models created by major reinsurers endowed with substantial human and financial resources, some companies such as RMS, Air and Eqecat have developed software designed to assess exposure to natural events. Some large international brokers have also set up their own software or use those designed by specialized companies.
The software systems designed are structured around:
- an entry data module for the insured sums per property use and per region,
- an estimate module for the frequency and the probable intensity of natural catastrophes,
- a module calculating the scope of damage sustained by the insured portfolio according to the intensity of the event,
- a module calculating the damage borne by the treaties according to insurance and reinsurance terms.
Global natural catastrophe losses in 2011
in billions USD| Five most costly catastrophes | Economic losses | Insured losses |
|---|---|---|
Global losses worldwide | 380 | 105 |
Earthquake and tsunami, Japan | 210 | 35-40 |
Earthquake, New Zealand | 16 | 14 |
Floods and landslides, Thailand | 40 | 15-20 |
Storms, United States | 15 | 73 |
Hurricane Irene, United States and Caribbean | 15 | 7 |
- Entry data module for the geographic distribution of insured sums per use
The ceding company holds important data regarding its portfolio. The density of insured property per area/CRESTA zone is supplied by the insurer. The overall insured sums split according to the nature of risk (simple, commercial, industrial, content risks, ...) is known by the insurer. The latter, therefore, sorts his risks according to geographical area or CRESTA zone if available. CRESTA zones are now recognized as an international standard for the zoning list achieved according to risk probability and intensity (www.cresta.org).
Some insurers are able to present a more accurate zoning based on the postal code of the policyholders. This configuration is especially useful for flood coverage. - Estimate module for the frequency and the probable intensity of natural catastrophes
The estimate of the frequency and the probable intensity of natural catastrophes are based on a module simulating events over hundreds of years. This module contains a historic data base pertaining to events having already occurred. In case of an earthquake cover, it yields data on the number of earthquakes listed, their geographic position, their intensity,..., in addition to the scientific data in the field integrated into the system as well.
- A module calculating the scope of damage sustained by the insured portfolio according to the intensity of the event
This module is designed to assess each simulation in terms of the vulnerability of the insured property according to its age, height, type of material used, ... and according to the intensity of the event simulated.
Details pertaining to age, height and kind of material used, compliance with construction standards observed to withstand natural events are pre-registered data. For instance: 30% of zone A constructions include buildings made of three-quarter bricks, of an average age of 15 years.
A vulnerability average rate is therefore obtained according to the intensity and the type of the insured property.
An average gross loss estimate (from ground-up) is then obtained by determining the yearly mean value of all losses artificially simulated over a long period of time. - A module calculating the damage supported by the treaties according to reinsurance terms
By applying reinsurance terms (commissions, priority, retention limit, limit per event, annual limit, ...) to the annual gross average loss, previously calculated, the reinsurer is able to determine the loss supported by the treaty. The total sum is made up of loss cost (capital cost but also management and acquisition cost) while the reinsurer’s profit margin determines the coverage cost (pure premium).
In addition to pricing, specific clauses such as limitation to natural catastrophe risks are used to limit the reinsurer’s engagement: defining covered perils, hourly clause, territorial limitation clause (for example: hurricane Louisiana and Florida), risk limitation clause, ...
Insured and reinsured catastrophe losses in 2011
in billions USD| Country | Insured losses | Reinsured losses | % of reinsurance | % of non domestic reinsurance |
|---|---|---|---|---|
Australia | 8 | 35 | 44% | 90% |
New Zeland | 14 | 125 | 89% | 100% |
Japan | 35-40 | 12-14 | 40% | 98% |
Thailand | 15-20 | 12 | 60% | 95% |
Chile | 85 | 8 | 95% | 100% |
2011 total | 75-85 | 40-42 | 54% | 96% |
Total including the 2010 Chile earthquake | 83-93 | 48-50 | 62% | 97% |
Capital influence
 The pricing system in use by reinsurers gathers the same risks per baskets whereby treaties covering natural catastrophes are associated with a basket of different risks from the one covering vehicles, which is placed in a basket other than that containing engineering acceptances, ...
A capital amount is, therefore, associated to each treaty (called risk capital) according to the basket where it belongs and thus to the type of risk: short-term/long-term class of business, probability of high frequency but low severity, probability of low frequency but high severity, ... the long-term classes of business (motor and third party liability) or natural catastrophes are most demanding in terms of capital.
The mutualization of all acceptances realized worldwide enables the reinsurer to minimize the capital associated with each treaty in the sense that risks are more or less independent. It is the case when two treaties are covering earthquakes in China and Brazil but not the case for two treaties covering storms in France and Great Britain. So the concentration of insured values remains problematic: dependence has to be taken into account.
Diversification per class of business, an essential criterion, also makes it possible to diminish capital endowment per treaty and thus the final price of covers. The more diversified a portfolio is, the more competitive the reinsurer theoretically gets.
The reinsurer, who obtains the treaty-backed capital on financial markets, will ask for a price for the mobilized capital: that is the cost of risk capital.
The capacity available on the reinsurance market is another important dimension to pricing. The higher the capacities are, the fiercer competition gets between reinsurers, thus promoting a soft market and vice versa.
The combination of factors pertaining to "occurrence of major catastrophe loss" and "capacity availability on the market" determines pricing cycles for the reinsurance of catastrophe risks.
Breakdown of losses per continent
| Economic losses | Insured losses |
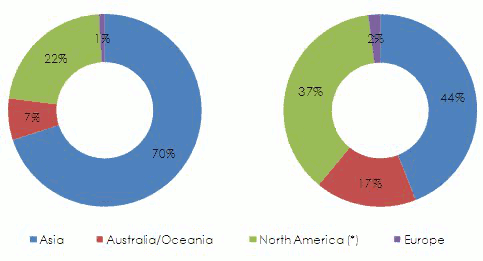 * Including Central America and Caribbean Sources: NatCatSERVICE, Munich Re, Swiss Re