Saudi Arabia 2012
Turnover’s breakdown per company: 2011-2012
in thousands USD| 2011 | 2012 | 2011/2012 evolution | 2012 shares | |
|---|---|---|---|---|
Tawuniya | 1 181 757 | 1 504 326 | 27.3% | 26.97% |
MEDGULF | 749 681 | 885 847 | 18.2% | 15.88% |
Bupa Arabia | 531 580 | 585 834 | 10.2% | 10.50% |
U C A | 285 092 | 273 406 | -4.1% | 4.90% |
Arabia Insurance | 150 696 | 174 590 | 15.9% | 3.13% |
ALLIANZ SF | 182 334 | 165 857 | -9.0% | 2.97% |
ALRAJHI | 131 570 | 160 419 | 21.9% | 2.88% |
SAICO | 146 265 | 151 622 | 3.7% | 2.72% |
Trade Union | 143 504 | 149 728 | 4.3% | 2.68% |
Malath Insurance | 160 257 | 148 992 | -7.0% | 2.67% |
AXA-Cooperative | 114 087 | 122 941 | 7.8% | 2.20% |
Gulf Union | 87 682 | 111 465 | 27.1% | 2.00% |
Gulf General | 126 605 | 98 936 | -21.9% | 1.77% |
Wataniya | 86 029 | 97 154 | 12.9% | 1.74% |
Arabian Shield | 73 136 | 88 514 | 21.0% | 1.59% |
Sagr Insurance | 62 583 | 87 362 | 39.6% | 1.57% |
Weqaya Takaful | 29 371 | 76 519 | 160.5% | 1.37% |
Al Alamiya | 60 787 | 66 230 | 9.0% | 1.19% |
Saudi Re | 42 566 | 65 419 | 53.7% | 1.17% |
Al-Ahlia | 70 308 | 62 910 | -10.5% | 1.13% |
Walaa Insurance | 74 289 | 62 498 | -15.9% | 1.12% |
Buruj | 27 825 | 62 351 | 124.1% | 1.12% |
SABB Takaful | 71 457 | 59 432 | -16.8% | 1.07% |
ACE | 59 917 | 55 694 | -7.0% | 1.00% |
SALAMA | 58 315 | 54 533 | -6.5% | 0.98% |
ACIG | 44 908 | 49 877 | 11.1% | 0.89% |
SANAD | 61 692 | 48 998 | -20.6% | 0.88% |
Saudi Indian (WAFA) | 25 041 | 43 374 | 73.2% | 0.78% |
ATC | 50 138 | 40 981 | -18.3% | 0.73% |
Amana | 77 284 | 14 446 | -81.3% | 0.26% |
Solidarity | 355 | 6 596 | 1759.6% | 0.12% |
Enaya | NA | NA | - | - |
Alinma Tokio M | NA | NA | - | - |
Total | 4 967 110 | 5 576 852 | 12.3% | 100% |
Breakdown of written premiums per class of business: 2011-2012
in thousands USD| 2011 | 2012 | 2012 shares | |
|---|---|---|---|
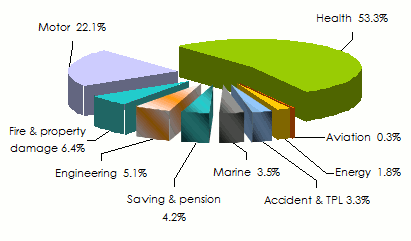
Aviation | 73 014 | 17 647 | 0.3% |
Energy | 96 905 | 101 402 | 1.8% |
Accident & third party liability | 169 651 | 181 997 | 3.3% |
Marine | 170 187 | 195 693 | 3.5% |
Saving and pension | 242 933 | 234 147 | 4.2% |
Engineering | 245 081 | 283 662 | 5.1% |
Fire and property damage | 310 579 | 355 039 | 6.4% |
Motor | 1 052 800 | 1 234 998 | 22.1% |
Health | 2 605 960 | 2 972 267 | 53.3% |
Total | 4 967 110 | 5 576 852 | 100% |
Breakdown of premiums per class of business in 2012
Exchange rate SAR/USD as at 31/12 | 2011 | 2012 |
0.26669 | 0.26698 |