SCOR, featuring among major players: 2007-2013, the boom
«Dynamic Lift» 2007-2010
 At the start of «Dynamic Lift», SCOR was completely reorganized, having two operational structures: life (SCOR Global Life) and non-life (SCOR Global P&C) and a Standard & Poor's rating of “A-”.
Following Revios acquisition, the group began another major operation in early 2007, the takeover of the Germano—Swiss reinsurer Converium, a move that earned SCOR 2 billion USD of revenues, primarily in non-life insurance. The Group then started to balance its life and non-life activities. Henceforth, the portfolio comprised 50% of non-life business and 50% of life, boosting SCOR to become the fifth market reinsurer.
To maintain close relationships with customers, the company was organized into six hubs: Cologne, London, New York, Paris, Singapore and Zurich, with forty four outlets scattered throughout the world.
Despite the global financial crisis in 2008, SCOR displayed positive quarterly results. In 2009, S&P upgraded the Group’s rating from “A-” to “A” with a stable outlook. Early September 2010, AM Best acted likewise.
Read also | SCOR group: 2000-2004, the difficult years
«Strong Momentum» 2010-2013
In September 2010, investors discovered the new development plan «Strong Momentum». Optimizing the Group’s risk profile, obtaining a safety level equivalent to an “AA” rating and 1000 point profitability, above the quarterly risk-free rate were the main objectives.
This plan was revised on September 7th , 2011 after the acquisition in August 2011 of the mortality risk portfolio of Transamerica Re. On September 6, 2012, the group made an assessment of its situation.
The so-called «Strong Momentum Season 3» document, supported by figures, showed that SCOR achieved its objectives, and is ready to seize new opportunities.
Between March 15, 2012 and June 5, 2012 that is in three months’ time, the four most important rating agencies upgraded SCOR’s rating to A+ for Fitch and Standard & Poor’s, to A for A.M. Best and to A1 for Moody’s.
The successive acquisitions in the United States, of Transamerica Re’s mortality portfolio in 2011 and of Generali’s life insurance in 2013, boosted SCOR as the number one overseas life reinsurer.
Positioning of SCOR Global P&C in 2012
| Regions | Country | Market position | Market share 1 |
|---|---|---|---|
| Europe | France | 3 | 9% |
| Italy | 3 | 11% | |
| Germany | 5 | 5% | |
| Benelux | 5 | 8% | |
| Nordic countries 2 | 3 | 14% | |
| Central and Eastern Europe | 3 | 8% | |
| Spain | 4 | 7% | |
| America | United States | 5 | 4% |
| Canada | 5 | 8% | |
| Latin America and the Caribbean | 5 | 4% | |
| Rest of the world | China | 3 | 6% |
| Japan | 3 | 4% | |
| India | 3 | 9% | |
| Middle East | 2 | 13% | |
| French - speaking Africa | 2 | 9% | |
| English - speaking Africa | 2 | 5% |
2 Denmark, Norway, Switzerland, Finland and Iceland Source: SCOR’s new strategic plan, «Optimal Dynamics»
The 2013-2016 forecasts: the «Optimal Dynamics» plan
In September 2013, the reinsurer has released its fifth triennial «Optimal Dynamics» plan, with priority to profitability and solvency.
The new objectives are to achieve a 1000-point ROE above the risk-free rate over the period and a solvency ratio between 185% and 220%. Optimal Dynamics rests on the assumption of an annual organic growth of 7%. Gross premiums collected by the group should therefore attain 13.3 billion EUR (17.5 billion USD) in 2016.
Evolution of the 2002-2006 strategic plan
in millions USD| Indicators | By the end of 2002 | By the end of «Back on Track» 2004 | By the end of «Moving Forward» 2007 | By the end of «Dynamic Lift» 2010 | By the end of «Strong Momentum» 2012 | Objectives of «Optimal Dynamics» 2016 |
|---|---|---|---|---|---|---|
ROE | NA | 5.8% | 14.1% | 10.2% | 9.1% | 1 |
Solvency ratio 2 | NA | NA | NA | NA | 221% | 185%-220% |
Turnover | 5 258 | 3 449 | 7 014 | 8 871 | 12 576 | 17 500 |
Turnover’s growth from one plan to another | NA | -34% | 103% | 26.4% | 41.7% | 39.1% |
Net result | -477 | 102 | 599 | 554 | 553 | NA |
The group’s staff | 1 256 | 1 038 | 1 840 | 1 822 | 2 184 | NA |
Loss ratio | NA | 91.63% | 90.6% | 71.2% | 65.40% | NA |
Non life combined ratio | NA | 100.1% | 97.3% | 100% | 94.40% | 93%-94% |
Life technical margin | NA | NA | 7.6% | 7% | 7.4% | 7% |
Appendices
Appendix 1: SCOR’s figures | Appendix 2: SCOR versus its competitors 2008-2012 |
|---|---|
1-1: Evolution of gross written premiums per geographic area: 2002-2012 | 2-1: Gross written premiums |
1-2: Evolution of net result: 2000-2012 | 2-2: Loss ratio |
1-3: Evolution of ROE : 2004- 2012 | 2-3: Management expenses ratio |
1-4: Evolution of staff: 2000-2012 | 2-4: Combined ratio |
1-5: List of SCOR’s shareholders in 2012 | 2-5: Net result |
1-6: Evolution of ratings :2003-2012 | 2-6: Net result /gross written premiums |
1-7: List of acquisitions | 2-7: Return on equity |
Appendix 1: SCOR’s figures
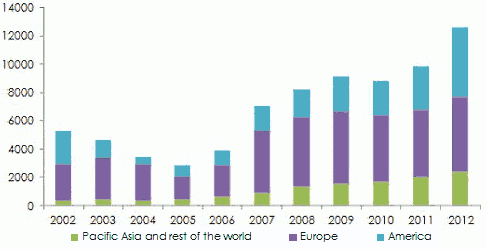
Evolution of gross written premiums per geographic area: 2002-2012
in millions USD| Years | Pacific Asia and rest of the world | Europe | America | Total |
|---|---|---|---|---|
| 2002 | 368 | 2 576 | 2 314 | 5 258 |
| 2003 | 417 | 2 966 | 1 251 | 4 634 |
| 2004 | 345 | 2 552 | 552 | 3 449 |
| 2005 | 456 | 1 597 | 798 | 2 851 |
| 2006 | 620 | 2 247 | 1008 | 3 875 |
| 2007 | 912 | 4 349 | 1 753 | 7 014 |
| 2008 | 1 310 | 4 911 | 1 965 | 8 186 |
| 2009 | 1 532 | 5 089 | 2 522 | 9 143 |
| 2010 | 1 721 | 4 734 | 2 416 | 8 871 |
| 2011 | 1 969 | 4 824 | 3 052 | 9 845 |
| 2012 | 2 389 | 5 283 | 4 904 | 12 576 |
Evolution of net result: 2000-2012
in millions USD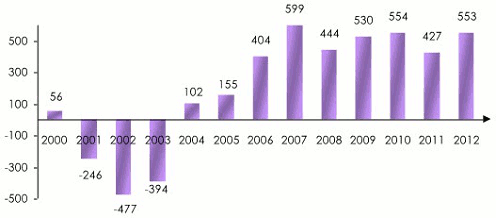
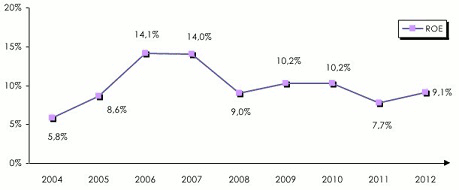
Evolution of ROE : 2004-2012
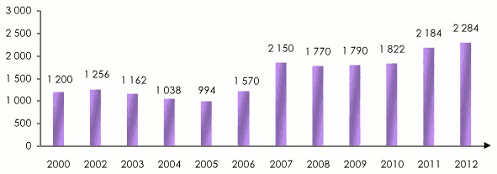
Evolution of staff: 2000-2012
List of shareholders in 2012
| Shareholders | Number of shares | % of the capital |
|---|---|---|
Patinex AG | 15 000 000 | 7.80% |
Alecta Kapitalförvaltning AB | 8 690 000 | 4.52% |
Generali Investments France S.A | 5 903 700 | 3.07% |
Groupe Malakoff | 5 875 500 | 3.05% |
BNP Paribas Asset Management (France) | 4 049 000 | 2.10% |
Covéa Finance | 4 034 300 | 2.10% |
BNP Paribas Investment Partners Belgium SA | 3 691 300 | 1.92% |
OFI Asset Management | 3 594 900 | 1.87% |
Treasury shares | 8 930 686 | 4.64% |
Employees | 6 189 679 | 3.22% |
Others | 126 425 154 | 65.71% |
Total | 192384 219 | 100% |
Evolution of ratings: 2003-2012
| Years | Standard & Poor’s | A.M. Best | Fitch Ratings | Moody’s |
|---|---|---|---|---|
| 2003 | BBB+ | B++ | BBB | Baa2 |
| 2005 | A- | B++ | BB+ | Baa2 |
| 2008 | A- | A- | A- | A3 |
| 2010 | A | A/a | A | A2 |
| 2013 | A+ | A/a+ | A+ | A1 |
List of acquisitions
| Years | Acquisitions |
|---|---|
| 1988 | La Vittoria Riassicurazioni (Italy) |
| 1989 | The Deutsche Kontinentale Rück (Germany) Merger of SCOR and UAP Re portfolios |
| 1996 | Allstate Re (United States) |
| 2000 | PartnerRe Life (United States) |
| 2001 | Sorema (France) |
| 2006 | Revios (Germany) |
| 2007 | Converium (Switzerland-Germany) |
| 2008 | Prévoyance Re (France) |
| 2009 | XL Re Life America (United States ) |
| 2011 | Transamerica Re (United States) |
| 2013 | Generali USA (United States) |
Appendix 2: SCOR versus its competitors: 2008-2012
Gross written premiums
in billions USD| 2008 | 2009 | 2008/2009 Evolution | 2010 | 2009/2010 Evolution | 2011 | 2010/2011 Evolution | 2012 | 2011/2012 Evolution | |
|---|---|---|---|---|---|---|---|---|---|
Munich Re | 30.873 | 34.233 | 10.88% | 31.28 | -8.63% | 33.719 | 7.80% | 37.251 | 10.47% |
Swiss Re | 23.226 | 27.647 | 19.03% | 24.756 | -10.46% | 28.664 | 15.79% | 31.273 | 9.10% |
Hannover Re | 11.448 | 14.728 | 28.65% | 15.147 | 2.84% | 15.664 | 3.41% | 18.208 | 16.24% |
Berkshire Hathaway | NA | NA | - | 14.374 | - | 15 | 4.36% | 15.059 | 0.39% |
SCOR | 8.186 | 9.143 | 11.69% | 8.871 | -2.97% | 9.845 | 10.98% | 12.576 | 27.74% |
Loss ratio 1
| 2008 | 2009 | 2010 | 2011 | 2012 | |
|---|---|---|---|---|---|
Munich Re | 69.60% | 66.10% | 69.80% | 83.90% | 61.20% |
Swiss Re | 68.90% | 60.50% | 66.20% | 73.50% | 53.10% |
Hannover Re | NA | 72.80% | 71.80% | 78.90% | 70.70% |
Berkshire Hathaway | NA | NA | NA | NA | NA |
SCOR | 70.50% | 70% | 71.20% | 76.60% | 65.40% |
Management expenses ratio 1
| 2008 | 2009 | 2010 | 2011 | 2012 | |
|---|---|---|---|---|---|
Munich Re | 29.90% | 29.70% | 31.30% | 30.40% | 30% |
Swiss Re | 29% | 27.80% | 28% | 28.10% | 30% |
Hannover Re | NA | 24% | 26.70% | 25.60% | 25.40% |
Berkshire Hathaway | NA | NA | NA | NA | NA |
SCOR | 28.10% | 28.80% | 27.30% | 27.90% | 29% |
Combined ratio
| 2008 | 2009 | 2010 | 2011 | 2012 | |
|---|---|---|---|---|---|
Munich Re | 99.50% | 95.80% | 101% | 114.20% | 91.20% |
Swiss Re | 97.90% | 88.30% | 94.20% | 101.60% | 83.10% |
Hannover Re | 95.40% | 96.80% | 98.50% | 104.50% | 96% |
Berkshire Hathaway | NA | 78.40% | 92.40% | 99.90% | 99.90% |
SCOR | 98.60% | 98.80% | 98.50% | 104.50% | 94.30% |
NA : not available
Net result 1
in billions USD| 2008 | 2009 | 2010 | 2011 | 2012 | |
|---|---|---|---|---|---|
Munich Re | 2.226 | 3.675 | 3.221 | 0.922 | 4.244 |
Swiss Re | -0.663 | 0.496 | 0.863 | 2.626 | 4.201 |
Hannover Re | -0.179 | 1.052 | 0.993 | 0.785 | 1.135 |
Berkshire Hathaway | NA | NA | NA | NA | NA |
SCOR | 0.444 | 0.53 | 0.554 | 0.427 | 0.553 |
Net result/gross written premiums 1
| 2008 | 2009 | 2010 | 2011 | 2012 | |
|---|---|---|---|---|---|
Munich Re | 7.21% | 10.74% | 10.30% | 2.73% | 11.39% |
Swiss Re | -2.85% | 1.79% | 3.49% | 9.16% | 13.43% |
Hannover Re | -1.56% | 7.14% | 6.56% | 5.01% | 6.23% |
Berkshire Hathaway | NA | NA | NA | NA | NA |
SCOR | 5.42% | 5.80% | 6.25% | 4.34% | 4.40% |
Return on equity
| 2008 | 2009 | 2010 | 2011 | 2012 | |
|---|---|---|---|---|---|
Munich Re | 7% | 11.80% | 10.40% | 3.30% | 12.60% |
Swiss Re | -3.40% | 2.30% | 3.60% | 9.60% | 13.40% |
Hannover Re | -4.10% | 22.40% | 18.20% | 12.80% | 15.60% |
Berkshire Hathaway | 4.25% | 6.90% | 8.91% | 6.37% | 8.32% |
SCOR | 9% | 10.20% | 10.20% | 7.70% | 9.10% |
NA : not available Exchange rate EUR/USD as at 31/12
2001: 0.886 | 2007: 1.47285 |
2002: 1.0483 | 2008: 1.40974 |
2003: 1.2557 | 2009: 1.4333 |
2004: 1.3644 | 2010: 1.3253 |
2005: 1.18445 | 2011: 1.29501 |
2006: 1.32027 | 2012: 1.3218 |