SORAS
 It has gradually managed to lay the ground for a development project that allows it today to display an average premium growth rate of 25%.
Member of the pan-African network GLOBUS, the company has been present on the Rwandan mar-ket in non-life and life insurance.
With a return on equity (ROE) over 20% and a steadily-growing turnover, SORAS has become a key player in the market.
Twenty five years following the establishment of the company, its business still depends heavily on the non-life class of business. The separation of life and non life segments into two specialized units is likely to enable SORAS to sustain the growth of its turnover.
The only downside: management expenditure which is at a high level.
 |  |  |
| Charles MPORANYI Chairman of SORAS Group | Marc RUGENERA General manager and board member | Jean Enoch HABIYAMBERE General manager SORAS-Life business |
SORAS in 2009
| Capital | 1 723 440 USD |
| Turnover | 11 941 445 USD |
| Total assets | 20 979 723 USD |
| Shareholder's equity | 4 235 860 USD |
| Net result after tax | 859 496 USD |
| ROE | 24.9% |
| Loss ratio | 69% |
| Combined ratio | 113.3% |
| Number of agencies | 17 |
| Number of employees | 199 |
Management
| Chairman of SORAS Group | Charles MPORANYI |
| General manager and board member | Marc RUGENERA |
| General manager life | Jean Enoch HABIYAMBERE |
| Commercial manager | Pierre Claver NKULIKIYINKA |
| Administrative and financial manager | Joseph NKIKABAHIZI |
| Production management | Anastase MBABAJENDE |
| Claims departement | Emmanuel SEKABUGA |
| Legal departement | Jean Claude MUNYANKUMBURW |
Main technical highlights: 2005-2009
in USD| 2005 | 2006 | 2007 | 2008 | 2009 | |
|---|---|---|---|---|---|
Gross written premiums | 4 867 752 | 5 482 496 | 7 722 546 | 10 458 372 | 11 941 445 |
Written premiums* | 4 326 110 | 4 812 526 | 6 773 590 | 9 763 454 | 10 256 781 |
Gross earned premiums | 4 100 409 | 4 706 439 | 6 152 754 | 9 542 611 | 10 435 837 |
Gross incurred losses | 3 114 152 | 3 363 691 | 3 867 550 | 6 234 766 | 7 202 596 |
Incurred losses * | 2 920 242 | 3 146 890 | 3 568 286 | 6 059 554 | 6 483 001 |
Gross loss ratio | 75.9% | 71.5% | 62.9% | 65.3% | 69% |
Management expenses 1 | 1 980 441 | 2 329 871 | 2 893 173 | 3 812 070 | 5 291 080 |
Technical result | 1 180 167 | 1 559 549 | 2 584 468 | 3 483 056 | 3 952 837 |
Financial income | 1 327 933 | 1 315 783 | 1 227 404 | 1 726 266 | 2 293 046 |
Net result after tax | 537 340 | 416 712 | 558 614 | 1 479 984 | 859 496 |
Evolution of premiums, losses, management expenses and results
in thousands USD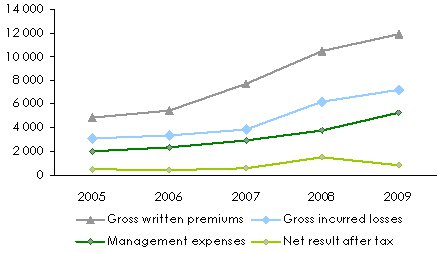
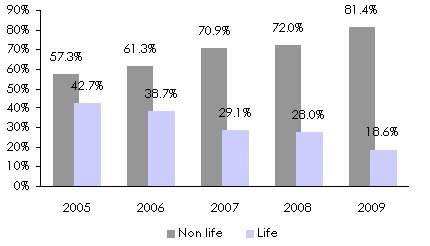
Turnover's evolution per class of business: 2005-2009
in USD| 2005 | 2006 | 2007 | 2008 | 2009 | 2009 shares | 2008/09 growth | |
|---|---|---|---|---|---|---|---|
Non life premiums | 2 788 187 | 3 362 826 | 5 474 538 | 7 527 274 | 9 719 938 | 81.4% | 29.1% |
Life premiums | 2 079 565 | 2 119 670 | 2 248 008 | 2 931 098 | 2 221 507 | 18.6% | -24.2% |
Total | 4 867 752 | 5 482 496 | 7 722 546 | 10 458 372 | 11 941 445 | 100% | 16.2% |
Turnover's breakdown per class of business: 2005-2009
Ratios' evolution: 2005-2009
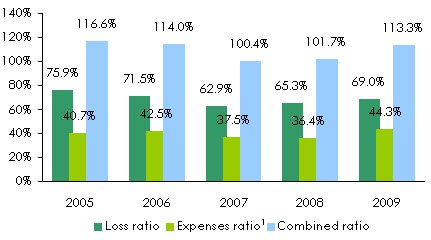 1 Management expenses on gross written premiums
 Exchange rate RWF/USD as at 31/12 | 2005 | 2006 | 2007 | 2008 | 2009 |
0.0017 | 0.00175 | 0.00181 | 0.00175 | 0.00172 |

Contact
| Head office | Boulevard de la Révolution, Kigali BP 924 Kigali, Rwanda |
| Phone | (+252) 25 057 6360 |
| Fax | (+252) 25 057 3362 |
info [at] soras [dot] co [dot] rw, infovie [at] soras [dot] co [dot] rw, infogroup [at] soras [dot] co [dot] rw | |
| Website |