Swan Insurance Company
 Being the first non-life insurance company with 22% of written premiums in 2010, the company has also life operations via its subsidiary Anglo-Mauritius Assurance Society Limited of which it is the major shareholder.
This non-life and life positioning enabled the group to diversify the products offered to individuals as well as to companies.
Swan Insurance has been listed on the Mauritius stock market since 1990, which puts the company at the heart of Mauritian economy, where it has become a major player.
Thanks to the reserves retained from life and non-life activities, the group managed to invest in tourism, real estate, the sugar industry, trade and financial operations.
An average loss ratio set around 50% per year, an expenses ratio contained below 28% for the last five years and a cautious financial management are the assets which contributed to Swan’s success.
The excellent results achieved have been enhanced by the presence of a panel of first-rate reinsurers alongside the company.
 |  |
| Cyril Mayer | Louis Rivalland |
| Chairman of the board of directors | Chief Executive Officer |
Swan Insurance in 2010
| Paid up capital | 1 222 365 USD |
| Turnover | 42 453 000 USD |
| Shareholder's equity | 34 045 683 USD |
| Total assets | 65 176 603 USD |
| Technical result | 12 925 735 USD |
| Profit | 6 136 984 USD |
| Loss ratio | 45.68% |
| Expenses ratio | 24.1% |
| Combined ratio | 69.78% |
Management
| Chief Executive Officer | Louis Rivalland |
| Operations executive officer | Michel Thomas |
| Development and projects manager | Jean Marc Chevreau |
| Technical manager | Guy de Gaye |
| Chief financial officer | Maxime Rey |
| Non life business manager | Rémi Desvaux de Marigny |
| IT manager | Alan Goder |
| Statistics and reinsurance manager | Tse Kwong Philippe Lo Fan Hin |
| Human resources manager | Vishnoo Luximan |
Main shareholders*
| Intendance Holding Limited | 100% |
Main technical highlights: 2006-2010
in thousands USD| 2006 | 2007 | 2008 | 2009 | 2010 | |
|---|---|---|---|---|---|
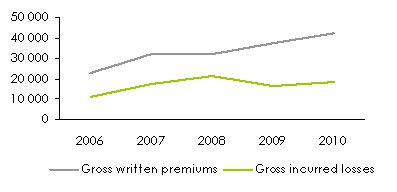
Gross written premiums | 22 912 | 32 209 | 31 998 | 37 290 | 42 453 |
Written premiums net of reinsurance | 10 504 | 13 264 | 13 889 | 15 632 | 17 684 |
Gross earned premiums | 21 686 | 32 307 | 31 250 | 35 662 | 39 901 |
Gross incurred losses | 11 064 | 17 484 | 21 368 | 16 622 | 18 228 |
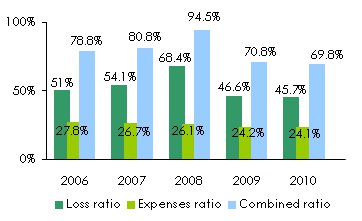
Loss ratio | 51% | 54.1% | 68.4% | 46.6% | 45.7% |
Management expenses | 6 374 | 8 610 | 8 343 | 9 017 | 10 231 |
- Commissions | 2 544 | 3 462 | 3 561 | 3 940 | 4 594 |
- Overhead expenses | 3 830 | 5 148 | 4 782 | 5 077 | 5 637 |
Expenses ratio | 27.8% | 26.7% | 26.1% | 24.2% | 24.1% |
Technical result | 4 525 | 7 176 | 9 198 | 11 256 | 12 926 |
Financial income | 1 797 | 2 344 | 2 387 | 2 724 | 2 925 |
Profit | 967 | 2 194 | 4 148 | 5 713 | 6 137 |
Evolution of technical ratios: 2006-2010
Evolution of premiums, losses, management expenses and results
in thousands USD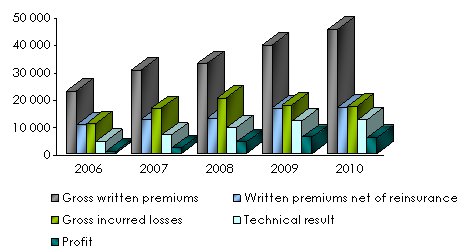
Evolution of premiums and losses: 2008-2010
in thousands USD| 2008 | 2009 | 2010 | |
|---|---|---|---|
Retained premiums | 13 889 | 15 632 | 17 684 |
In % of the gross written premiums | 43.4% | 41.9% | 41.7% |
Premiums ceded to reinsurers | 18 109 | 21 658 | 24 769 |
In % of the gross written premiums | 56.6% | 58.1% | 58.3% |
Total | 31 998 | 37 290 | 42 453 |
Net losses | 10 741 | 8 837 | 9 292 |
In % of the gross incurred losses | 50.3% | 53.2% | 51% |
Recoveries from reinsurers | 10 627 | 7 785 | 8 936 |
In % of the gross incurred losses | 49.7% | 46.8% | 49% |
Total | 21 368 | 16 622 | 18 228 |
in thousands USD
Turnover’ evolution per class of business: 2008-2010
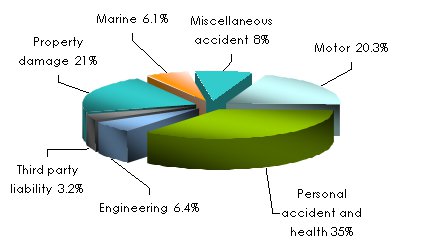
| 2008 | 2009 | 2010 | 2009-2010 evolution | 2010 shares | |
|---|---|---|---|---|---|
Motor | 7 481 | 8 271 | 8 638 | 4.4% | 20.3% |
Personal accident and health | 8 123 | 10 519 | 14 877 | 41.4% | 35% |
Engineering | 2 691 | 3 987 | 2 703 | -32.2% | 6.4% |
Third party liability | 1 145 | 1 224 | 1 330 | 8.7% | 3.2% |
Property damage | 6 831 | 7 564 | 8 930 | 18.1% | 21% |
Marine | 3 115 | 3 091 | 2 572 | -16.8% | 6.1% |
Miscellaneous accident | 2 612 | 2 634 | 3 403 | 29.1% | 8% |
Grand total | 31 998 | 37 290 | 42 453 | 13.8% | 100% |
Premiums’ breakdown per class of business in 2010
Loss ratio’s evolution per class of business: 2008-2010
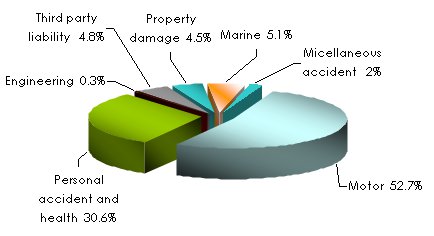
| 2008 | 2009 | 2010 | |
|---|---|---|---|
Motor | 67.3% | 61.3% | 57.3% |
Personal accident and health | 75.9% | 65.9% | 68.1% |
Engineering | 4.1% | 103.8% | 16.1% |
Third party liability | 24.2% | 15.7% | 36.2% |
Property damage | 32.6% | 30.8% | 19.5% |
Marine | 24.4% | 16.3% | 29.4% |
Miscellaneous accident | 24.0% | 62.2% | 27.8% |
Grand total | 54.9% | 49.2% | 50.1% |
Losses’ breakdown per class of business in 2010
Exchange rate MUR/USD as at 31/12 | 2006 | 2007 | 2008 | 2009 | 2010 |
0.03026 | 0.03632 | 0.03352 | 0.03421 | 0.03409 |

Contact
| Head office | Swan Group Centre, 10 Intendance Street, Port-Louis, Mauritius |
| Phone | (+230) 207 3500 |
| Fax | (+230) 208 6898 |
info [at] swan [dot] mu | |
| Website |
