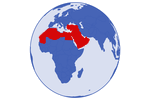
Middle East and North Africa insurance market in 2017
The United Arab Emirates, Saudi Arabia and Morocco remain at the top of the ranking. These three countries alone accounted for 68.6% of the total premium volume. Qatar ranks fourth with a market share of 8.74%.
Related article | MENA: Top 50 insurance companies
Evolution of life and non-life premiums (2016-2017)
In millions USD| 2017 | 2016 | Market shares 2017 | Evolution 2016/2017 | |
|---|---|---|---|---|
Life premiums | 7 103 | 7 095 | 18.08% | 0.11% |
Non life premiums | 32 188 | 30 341 | 81.92% | 6.08% |
| Total market | 39 291 | 37 436 | 100% | 4.96% |
Insurance market in the Middle East and North Africa: Evolution of premiums of the main countries (2016-2017)
In millions USD| 2017 | 2016 | Market shares 2017 | Evolution 2016/2017 | |
|---|---|---|---|---|
United Arab Emirates | 13 519 | 11 949 | 34.41% | 13.16% |
Saudi Arabia | 9 717 | 9 828 | 24.74% | -1.13% |
Morocco | 3 718 | 3 561 | 9.46% | 4.41% |
Qatar | 3 435 ** | 2 935 | 8.74% | 17.03% |
Lebanon | 1 635 | 1 571 | 4.16% | 4.00% |
Egypt | 1 587 | 2 125 | 4.04% | -25.32% |
Algeria | 1 216 | 1 197 | 3.09% | 1.50% |
Oman | 1 214 | 1 071 | 3.09% | 13.35% |
Jordan | 854 | 821 | 2.17% | 4.02% |
Kuwait | 821 | 797 | 2.09% | 3.01% |
Tunisia | 813 | 857 | 2.07% | -5.02% |
Bahrain | 762 | 724 | 1.94% | 5.23% |
| Total market | 39 291 | 37 436 | 100% | 4.96% |
Insurance market in the Middle East and North Africa: Evolution of life premiums (2016-2017)
In million USD| 2017 | 2016 | Market shares 2017 | Evolution 2016/2017 | |
|---|---|---|---|---|
United Arab Emirates | 3 132 | 2 976 | 44.09% | 5.27% |
Morocco | 1 523 | 1 457 | 21.44% | 4.53% |
Egypt | 761 | 1 021 | 10.71% | -25.39% |
Lebanon | 505 | 484 | 7.11% | 4.55% |
Saudi Arabia* | 283 | 280 | 3.98% | 1.07% |
Tunisia | 166 | 175 | 2.34% | -5.14% |
Oman | 161 | 164 | 2.27% | -1.83% |
Kuwait | 153 | 150 | 2.15% | 2% |
Bahrain | 139 | 137 | 1.96% | 1.46% |
Algeria | 117 | 105 | 1.65% | 11.43% |
Jordan | 108 | 99 | 1.52% | 9.09% |
Qatar | 55 ** | 47 | 0.78% | 17.02% |
| Total market | 7 103 | 7 095 | 100% | 0.11% |
Insurance market in the Middle East and North Africa: Evolution of non life premiums (2016-2017)
In million USD| 2017 | 2016 | Market shares 2017 | Evolution 2016/2017 | |
|---|---|---|---|---|
United Arab Emirates | 10 387 | 8 975 | 32.27% | 15.75% |
Saudi Arabia | 9 434 | 9 548 | 29.31% | -1.19% |
Qatar | 3 380 ** | 2 888 | 10.50% | 17.04% |
Morocco | 2 195 | 2 103 | 6.82% | 4.37% |
Lebanon | 1 130 | 1 089 | 3.51% | 3.86% |
Algeria | 1 099 | 1 091 | 3.41% | 0.73% |
Oman | 1 053 | 906 | 3.27% | 16.22% |
Egypt | 826 | 1 104 | 2.57% | -25.18% |
Jordan | 746 | 722 | 2.32% | 3.32% |
Kuwait | 668 | 647 | 2.07% | 3.24% |
Tunisia | 647 | 682 | 2.01% | -5.13% |
Bahrain | 623 | 586 | 1.94% | 6.32% |
| Total market | 32 188 | 30 341 | 100% | 6.08% |
*Due to the unavailability of 2017 data, some countries of the Middle East and North Africa are not included in this study
** Data were estimated by Atlas Magazine Source : Sigma, Swiss Re Institute
** Data were estimated by Atlas Magazine Source : Sigma, Swiss Re Institute
 |
0
Your rating: None
Tue, 24/07/2018 - 14:09
The online magazine
Live coverage
16:28
16:04
11:51
04/24
04/24
Latest news