The Kenyan insurance market

Insurance market features
- Regulatory authority: Ministry of Finance Insurance department
- Life and non life premiums (2007): 761 million USD
- Insurance density (2007): 20.29 USD
- Penetration rate (2007): 2.62%
Market structure in 2007
Actors | Number |
|---|---|
Insurance companies | 44 |
-Life companies | 7 |
-Non life companies | 20 |
-Composite | 15 |
-Reinsurance companies | 2 |
Brokers | 201 |
Insurance agents | 2 665 |
Identity
- Area: 582 647 Km2
- Population (2007): 37 500 000 inhabitants
- GDP (2007): 29 billion USD
- GDP per capita (2007): 773 USD
- GDP growth rate (2007): 6.7%
- Inflation rate (2007): 9.7%
- Main economic sectors: agriculture (tea, coffee, wheat, corn, sugar cane), aluminium, cement, tourism
Major cities
(in number of inhabitants)
- Nairobi (capital): 3 000 000
- Mombasa: 900 000
- Kisumu: 400 000
- Nakuru: 300 000
Breakdown of life and non life premiums: 2002-2007
in USD| 2002 | 2003 | 2004 | 2005 | 2006 | 2007 | |
|---|---|---|---|---|---|---|
Non life | 224 162 300 | 256 080 000 | 295 001 000 | 350 635 900 | 421 940 000 | 521 237 541 |
Life* | 94 973 000 | 112 200 000 | 129 111 500 | 152 324 300 | 180 336 000 | 240 147 600 |
Grand total | 319 135 300 | 368 280 000 | 424 112 500 | 502 960 200 | 602 276 000 | 761 385 141 |
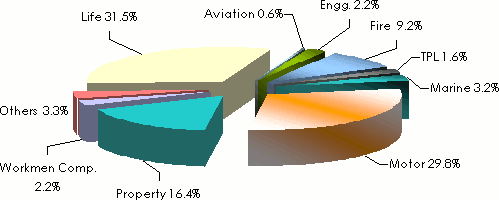
Breakdown by class of business in 2007
in thousands USD| Gross premiums | Technical results | Market shares | |
|---|---|---|---|
| Non life | |||
Aviation | 4 136 | - 114 632 | 0.6% |
Engineering | 16 576 | 2 021 841 | 2.2% |
Fire | 70 115 | 2 170 453 | 9.2% |
TPL | 11 993 | 2 045 658 | 1.6% |
Marine | 24 921 | 2 007 684 | 3.2% |
Motor | 226 755 | 18 088 | 29.8% |
Property | 124 575 | 5 864 948 | 16.4% |
Workmen Compensation1 | 16 986 | - 11 032 100 | 2.2% |
Agriculture | 48 | 12 577 | 0.01% |
Others | 25 132 | 2 786 143 | 3.3% |
Non life total | 521 237 | 5 780 661 | 68.5% |
| Life | |||
Life | 240 148 | - | 31.5% |
Grand total | 761 385 | - | 100% |
Loss ratio by class of business: 2004-2007
in %| 2004 | 2005 | 2006 | 2007 | |
|---|---|---|---|---|
Aviation | NA | 33.3 | 11.5 | 52.5 |
Engineering | 39 | 45.5 | 52.4 | 26.8 |
Fire domestic | 25.5 | 29.2 | 26.8 | 26.1 |
Fire industrial | 39.8 | 20.2 | 34 | 59.1 |
TPL | 41.4 | 51.4 | 49.1 | 27.4 |
Marine | 33.3 | 34.4 | 39.5 | 47.4 |
Motor private | 62.8 | 82.3 | 75.8 | 75.8 |
Motor commercial | 47.5 | 49.2 | 51 | 50.6 |
Personal accident | 64.6 | 64.9 | 73.4 | 68.0 |
Theft | 51.4 | 51.3 | 59.1 | 51.6 |
Agriculture | NA | NA | NA | 40.1 |
Workmen Compensation | 104.6 | 95.2 | 90.4 | 104.8 |
Others | 40.7 | 27 | 21.8 | 40.5 |
Average | 56 | 48.7 | 61.1 | 61.7 |
Gross premiums of the top ten non life companies
in USD| 2006 gross premiums | Market shares | 2007 gross premiums | Market shares | 2006/07 growth | |
|---|---|---|---|---|---|
Kenindia | 41 960 589 | 9.9% | 47 911 329 | 9.2% | 14.2% |
Jubilee | 27 753 815 | 6.6% | 38 763 027 | 7.4% | 39.7% |
Pan Africa | 31 773 189 | 6.9% | 37 265 307 | 7.1% | 17.3% |
Blue Shield | 29 128 960 | 6.9% | 35 966 991 | 6.9% | 23.5% |
UAP | 22 802 418 | 5.4% | 31 640 886 | 6.1% | 38.8% |
AIG | 24 482 548 | 5.8% | 28 503 210 | 5.5% | 16.4% |
Heritage | 18 908 764 | 4.5% | 23 811 916 | 4.6% | 25.9% |
Lion | 17 193 058 | 4.1% | 19 263 270 | 3.7% | 12.0% |
ICEA | 16 805 610 | 4.0% | 18 559 518 | 3.6% | 10.4% |
First Assurance | 12 534 710 | 3.0% | 16 429 862 | 3.2% | 31.1% |
Top ten companies total | 243 343 661 | 57% | 298 115 316 | 57.2% | 22.5% |
Rest of the market1 | 178 596 339 | 43% | 223 122 225 | 42.8% | 24.9% |
Grand total | 421 940 000 | 100% | 521 237 541 | 100% | 23.5% |
Gross premiums of the top ten life companies
in USD| 2006 gross premiums | Market shares | 2007 gross premiums | Market shares | 2006/07 growth | |
|---|---|---|---|---|---|
Pan Africa | 20 185 321 | 17.3% | 32 754 250 | 21.4% | 62.27% |
British American | 22 217 540 | 19.1% | 29 452 394 | 19.3% | 32.56% |
Co-operative | 8 852 402 | 7.6% | 14 529 104 | 9.5% | 64.13% |
CFC Life | 11 528 066 | 9.9% | 14 148 570 | 9.3% | 22.73% |
Jubilee | 6 639 586 | 5 .7% | 11 633 015 | 7.6% | 75.21% |
ICEA | 12 811 962 | 11% | 10 902 068 | 7.1% | -14.91% |
Madison | 7 975 808 | 6.8% | 8 193 542 | 5.4% | 2.73% |
Old Mutual | 6 557 338 | 5.6% | 7 562 704 | 4.9% | 15.33% |
Kenindia | 4 251 161 | 3.7% | 4 701 008 | 3.1% | 10.58% |
Pioneer | 2 394 307 | 2.1% | 2 967 959 | 1.9% | 23.96% |
Top ten companies total | 103 413 491 | 88.8% | 136 844 614 | 89.5% | 32.3% |
Rest of the market 1 | 13 052 336 | 11.2% | 15 996 867 | 10.5% | 22.6% |
Total2 | 116 465 827 | 100% | 152 841 481 | 100% | 31.2% |
Deposit administration contributions | 63 870 173 | - | 87 306 119 | - | 36.6% |
Grand toal | 180 336 000 | - | 240 147 600 | - | 33.1% |
Exchange rate KES/USD as at 31/12 | 2002 | 2003 | 2004 | 2005 | 2006 | 2007 |
0.01301 | 0.01320 | 0.01295 | 0.01381 | 0.01445 | 0.01582 |
Live coverage
04/16
04/16
04/16
04/16
04/15
Latest news