The Omani insurance market

Insurance market features
- Regulatory authority: Capital Market Authority - Directorate of Insurance Supervision
- Life and non life premiums (2013): 948 million USD
- Insurance density (2013): 239.6 USD
- Penetration rate (2013): 1.15%
Insurance market structure 2013
Actors | Number |
|---|---|
National insurance companies | 10 |
Foreign insurance companies | 11 |
Country profile
- Area: 309 500 km2
- Population (2013): 3 957 000 inhabitants
- GDP (2013): 81.95 billion USD
- GDP/capita (2013): 20 710 USD
- GDP growth rate (2013): 5.1%
- Inflation rate (2013): 1.6%
- Main economic sectors: oil production, natural gas, asbestos, copper, marble, optic fiber, metal manufacturing, textile industry, fish export.
Main cities
(per number of inhabitants in 2012 )
- Muscat (capital): 1 090 797
- Bawshar: 343 602
- As Seeb: 310 673
Evolution of life and non life gross written premiums: 2009-2013
in thousands USD| 2009 | 2010 | 2011 | 2012 | 2013 | |
|---|---|---|---|---|---|
Non life | 526 232 | 539 573 | 570 195 | 751 451 | 860 697 |
Life | 102 341 | 106 540 | 158 304 | 105 241 | 87 732 |
Total | 628 573 | 646 113 | 728 499 | 856 692 | 948 429 |
Evolution of life and non life gross written premiums: 2009-2013
in thousands USD
Evolution of life and non life net written premiums: 2009-2013
in thousands USD| 2009 | 2010 | 2011 | 2012 | 2013 | |
|---|---|---|---|---|---|
Non life | 282 432 | 266 580 | 323 712 | 402 325 | 463 279 |
Life | 49 730 | 55 031 | 45 850 | 47 183 | 45 955 |
Total | 332 162 | 321 611 | 369 562 | 449 508 | 509 234 |
Evolution of life and non life net written premiums: 2009-2013
in thousands USD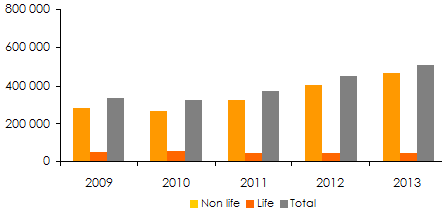
Gross written premiums per company: 2009-2013
in thousands USD| 2009 | 2010 | 2011 | 2012 | 2013 | 2012-2013 evolution | 2013 shares | |
|---|---|---|---|---|---|---|---|
Dhofar Insurance Company | 151 924 | 139 407 | 135 377 | 141 087 | 162 671 | 15.3% | 17.2% |
National Life Insurance & General | 57 780 | 64 870 | 91 727 | 114 007 | 145 903 | 28.0% | 15.4% |
Oman United Insurance | 52 424 | 54 704 | 78 891 | 94 483 | 105 091 | 11.2% | 11.1% |
Al Ahlia Insurance Company | 70 812 | 63 253 | 76 903 | 86 516 | 89 727 | 3.7% | 9.5% |
New India Assurance | 38 148 | 51 500 | 61 507 | 67 945 | 76 716 | 12.9% | 8.1% |
Axa Insurance | 26 638 | 27 763 | 31 699 | 46 055 | 54 438 | 18.2% | 5.7% |
Oman & Qatar Insurance | 13 531 | 21 681 | 37 210 | 48 137 | 48 932 | 1.7% | 5.2% |
Al Madina Gulf Insurance | 33 741 | 30 642 | 36 329 | 43 881 | 46 106 | 5.1% | 4.9% |
Falcon Insurance | 26 349 | 24 372 | 25 137 | 27 686 | 34 045 | 23.0% | 3.6% |
Vision Insurance | 24 858 | 27 400 | 27 992 | 31 912 | 33 117 | 3.8% | 3.5% |
Muscat Insurance | 18 644 | 21 581 | 21 431 | 23 540 | 27 936 | 18.7% | 2.9% |
Arabia Insurance | 19 368 | 18 977 | 20 416 | 28 749 | 27 801 | -3.3% | 2.9% |
Metlife Alico Insurance | 17 132 | 18 459 | 20 271 | 22 172 | 24 086 | 8.6% | 2.5% |
Oman Insurance | 10 877 | 12 847 | 13 202 | 27 175 | 20 923 | -23.0% | 2.2% |
Zurich Middle East | - | 2 782 | 7 313 | 13 411 | 15 273 | 13.9% | 1.6% |
Arab Orient | 1 844 | 9 756 | 10 091 | 9 586 | 12 879 | 34.4% | 1.4% |
AIG MEA | - | - | - | - | 9 211 | - | 1% |
Iran Insurance | 3 048 | 4 604 | 3 960 | 4 326 | 3 906 | -9.7% | 0.4% |
Life Insurance Corp Inter | 5 459 | 5 492 | 6 092 | 4 576 | 3 683 | -19.5% | 0.4% |
Saudi Arabian Insurance | - | 2 782 | 3 730 | 3 478 | 3 670 | 5.5% | 0.3% |
Muscat Life Insurance | 12 919 | 10 684 | 13 973 | 9 375 | 2 315 | -75.3% | 0.2% |
Royal & Sun Alliance Insurance | 31 617 | 26 844 | - | - | - | - | - |
Lebanese Insurance | 2 926 | - | - | - | - | - | - |
Chartis Memsa | 5 254 | 5 713 | 5 248 | 8 595 | - | - | - |
Al Nisr insurance | 3 280 | - | - | - | - | - | - |
Total | 628 573 | 646 113 | 728 499 | 856 692 | 948 429 | 10.7% | 100% |
Breakdown of gross written premiums per class of business: 2009-2013
in thousands USD| 2009 | 2010 | 2011 | 2012 | 2013 | 2013 shares | |
|---|---|---|---|---|---|---|
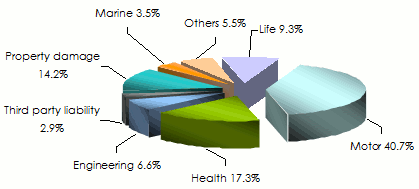
Motor | 262 861 | 270 625 | 299 151 | 352 842 | 385 961 | 40.7% |
Health | - | - | - | 118 635 | 164 533 | 17.3% |
Engineering | - | - | - | 59 182 | 62 244 | 6.6% |
Third party liability | - | - | - | 24 565 | 27 677 | 2.9% |
Property damage | 135 808 | 125 931 | 108 221 | 111 052 | 135 037 | 14.2% |
Marine | 30 818 | 38 756 | 45 522 | 31 638 | 33 094 | 3.5% |
Others | 96 745 | 104 261 | 117 301 | 53 537 | 52 151 | 5.5% |
Total Non life | 526 232 | 539 573 | 570 195 | 751 451 | 860 697 | 90.7% |
Life | 102 341 | 106 540 | 158 304 | 105 241 | 87 732 | 9.3% |
Grand total | 628 573 | 646 113 | 728 499 | 856 692 | 948 429 | 100% |
Breakdown of gross written premiums per class of business in 2013
Breakdown of net written premiums per class of business: 2009-2013
in thousands USD| 2009 | 2010 | 2011 | 2012 | 2013 | 2013 shares | |
|---|---|---|---|---|---|---|
Motor | 220 156 | 209 280 | 233 731 | 299 695 | 333 968 | 65.6% |
health | - | - | 34 570 | 48 012 | 65 364 | 12.8% |
Engineering | - | - | 16 204 | 13 724 | 17 025 | 3.3% |
Third party liability | - | - | 7 372 | 8 643 | 9 170 | 1.8% |
Property damage | 14 413 | 10 402 | 7 034 | 7 581 | 10 129 | 2% |
Marine | 11 698 | 9 515 | 9 248 | 7 105 | 8 061 | 1.6% |
Others | 36 165 | 37 383 | 15 553 | 17 565 | 19 562 | 3.9% |
Total Non life | 282 432 | 266 580 | 323 712 | 402 325 | 463 279 | 91% |
Life | 49 730 | 55 031 | 45 850 | 47 183 | 45 955 | 9% |
Grand total | 332 162 | 321 611 | 369 562 | 449 508 | 509 234 | 100% |
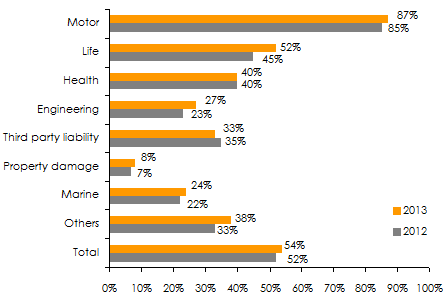
Retention rate: 2012-2013
Exchange rate OMR/USD as at 31/12 | 2009 | 2010 | 2011 | 2012 | 2013 |
2.60722 | 2.60688 | 2.60512 | 2.59875 | 2.60518 |
Live coverage
04/19
04/19
04/19
04/19
04/18

Latest news