The Turkish insurance market

Insurance market features
- Regulatory authority: General Directorate of Insurance -
Under-secretariat of Treasury - Premiums (2003): 3 544 millions USD
- Insurance density (2003): 50.13 USD
- Penetration rate (2003): 0.77%
2003 market structure
Actors | Number |
|---|---|
Non life companies | 35 |
Life companies | 24 |
Reinsurance companies | 3 |
Private pension funds | 11 |
Number of insurance agencies | 17 576 |
Number of bank guichets* | 13 271 |
Identity
- Area: 780 580 Km2
- Population (2004):
70 700 000 inhabitants - GDP (2003) :
458.5 billion USD - GDP per capita (2003):
6 500 USD - GDP growth rate (2003): 5.8%
- Inflation rate (2003): 25.3%
- Main economic sectors: textile industry, household appliances, motor industry, agriculture (tobacco, cotton, sugar, cattle), food industry, tourism
Major cities
(in number of inhabitants)
- Istambul: 10 500 000
- Ankara (capital): 3 700 000
- Izmir: 3 200 000
- Bursa: 2 000 000
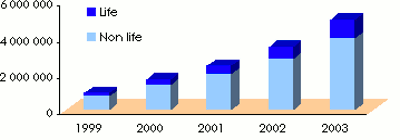
Life and non life premiums' evolution: 1999-2003
in billion TRL| Premiums | 1999 | 2000 | 2001 | 2002 | 2003 |
|---|---|---|---|---|---|
Non life | 174 869 | 326 197 | 461 349 | 671 440 | 1 029 920 |
Life | 743 783 | 1 367 415 | 1 961 609 | 2 825 944 | 3 944 278 |
Total | 918 652 | 1 693 612 | 2 422 958 | 3 497 384 | 4 974 198 |
Non life premiums split by class of business and by company in 2003
in millions USD| Fire | Marine | Casualty | Engg. | Agric. risks | Health | Non life total | Life | Grand total | |
|---|---|---|---|---|---|---|---|---|---|
AXA OYAK | 55.13 | 13.26 | 226.83 | 11.04 | 0.05 | 0.00 | 306.31 | 0.00 | 306.31 |
ANADOLU ANONIM TÜRK | 89.16 | 23.15 | 176.25 | 15.52 | 0.03 | 0.00 | 304.11 | 0.00 | 304.11 |
AKSIGORTA | 69.12 | 13.47 | 150.50 | 10.30 | 0.35 | 8.41 | 252.15 | 3.40 | 255.55 |
YAPI KREDI | 33.74 | 5.57 | 85.69 | 12.28 | 0.00 | 80.40 | 217.68 | 0.00 | 217.68 |
KOC ALLIANZ | 69.56 | 15.16 | 112.83 | 16.46 | 1.17 | 0.12 | 215.30 | 0.00 | 215.30 |
GÜNES | 54.19 | 10.53 | 105.60 | 25.41 | 0.88 | 3.68 | 200.29 | 1.32 | 201.61 |
ISVICRE | 27.09 | 10.97 | 124.03 | 3.83 | 1.36 | 0.00 | 167.28 | 0.00 | 167.28 |
BASAK | 35.76 | 9.52 | 90.02 | 10.53 | 6.90 | 7.88 | 160.61 | 3.34 | 163.95 |
RAY | 15.96 | 4.27 | 77.60 | 5.92 | 0.00 | 0.00 | 103.75 | 0.00 | 103.75 |
GARANTI | 26.76 | 8.29 | 35.22 | 7.79 | 0.00 | 6.50 | 84.56 | 0.00 | 84.56 |
T. GENEL | 18.01 | 4.26 | 48.01 | 6.31 | 0.00 | 3.17 | 79.76 | 0.00 | 79.76 |
COMMERCIAL UNION | 17.85 | 3.54 | 35.80 | 3.60 | 0.00 | 0.00 | 60.79 | 0.00 | 60.79 |
FINANS | 8.81 | 1.64 | 40.62 | 2.05 | 0.00 | 0.00 | 53.12 | 0.00 | 53.12 |
GÜVEN | 7.02 | 1.58 | 34.32 | 1.24 | 3.43 | 1.04 | 48.63 | 0.00 | 48.63 |
SEKER | 7.01 | 1.01 | 28.95 | 2.57 | 0.29 | 0.06 | 39.89 | 0.48 | 40.37 |
ANKARA ANONIM TÜRK | 4.19 | 0.78 | 33.01 | 0.91 | 0.00 | 0.00 | 38.89 | 0.00 | 38.89 |
GENERALI | 10.59 | 1.42 | 16.81 | 3.47 | 0.00 | 0.06 | 32.35 | 0.01 | 32.36 |
ISIK | 7.81 | 1.56 | 18.15 | 1.15 | 0.00 | 0.35 | 29.02 | 0.00 | 29.02 |
BATI | 5.09 | 0.83 | 19.01 | 0.76 | 0.00 | 1.48 | 27.17 | 0.06 | 27.23 |
TEB | 8.26 | 3.06 | 12.62 | 2.12 | 0.00 | 0.00 | 26.06 | 0.00 | 26.06 |
AIG | 3.59 | 2.60 | 16.92 | 2.72 | 0.00 | 0.00 | 25.83 | 0.00 | 25.83 |
IHLAS | 1.98 | 0.30 | 18.48 | 0.28 | 0.00 | 0.38 | 21.42 | 0.00 | 21.42 |
BIRLIK | 5.10 | 0.26 | 14.59 | 0.70 | 0.00 | 0.25 | 20.90 | 0.00 | 20.90 |
HÜR | 0.67 | 0.12 | 10.94 | 0.03 | 0.00 | 0.00 | 11.76 | 0.00 | 11.76 |
T. NIPPON | 0.67 | 0.13 | 7.57 | 0.19 | 0.00 | 0.20 | 8.76 | 0.00 | 8.76 |
KAPITAL | -0.20 | 0.02 | 5.91 | -0.15 | 0.00 | 0.00 | 5.58 | 0.00 | 5.58 |
TICARET | 1.11 | 0.07 | 1.85 | 0.05 | 0.00 | 0.00 | 3.08 | 0.00 | 3.08 |
TOPRAK | 0.12 | 0.03 | 1.23 | 0.17 | 0.00 | 0.00 | 1.55 | 0.00 | 1.55 |
SANKO | 0.53 | 0.64 | 0.19 | -0.08 | 0.00 | 0.00 | 1.28 | 0.00 | 1.28 |
RUMELI | 0.40 | 0.05 | 0.32 | 0.09 | 0.00 | 0.00 | 0.86 | 0.00 | 0.86 |
DEMIR | -0.07 | 0.12 | 0.79 | -0.05 | 0.00 | 0.00 | 0.79 | 0.00 | 0.79 |
EGS | 0.00 | 0.00 | 0.00 | 0.00 | 0.00 | 0.00 | 0.00 | 0.00 | 0.00 |
MAGDEBURGER | 0.00 | 0.00 | 0.00 | 0.00 | 0.00 | 0.00 | 0.00 | 0.00 | 0.00 |
G.I.C. DÜNYA | 0.00 | 0.00 | 0.00 | 0.00 | 0.00 | 0.00 | 0.00 | 0.00 | 0.00 |
MERKEZ | 0.00 | 0.00 | 0.00 | 0.00 | 0.00 | 0.00 | 0.00 | -0.16 | -0.16 |
Total | 585.01 | 138.21 | 1 550.66 | 147.21 | 14.46 | 113.98 | 2 549.53 | 8.45 | 2 557.98 |
Evolution of the loss ratio split by class of business
| 2000 | 2001 | 2002 | 2003 | |
|---|---|---|---|---|
Fire | 39.60% | 65.97% | 42.16% | 38.30% |
Marine | 56.62% | 66.81% | 51.93% | 47.46% |
Casualty | 66.95% | 71.13% | 68.14% | 77.92% |
Engineering | 69.05% | 206.60% | 66.32% | 60.38% |
Agricultural risks | 36.00% | 50.03% | 60.09% | 113.10% |
Health | 76.04% | 76.66% | 74.75% | 80.98% |
Life premiums split by class of business and by company in 2003
in millions USD| Casualty | Health | Non life total | Life | Grand total | |
|---|---|---|---|---|---|
ANADOLU H. EMEKLILIK | 0.00 | 57.98 | 57.98 | 241.19 | 299.17 |
KOC ALLIANZ H. EMEKLILIK | 2.08 | 93.15 | 95.23 | 53.20 | 148.43 |
COMMERCIAL UNION H.E. | 0.00 | 1.70 | 1.70 | 103.54 | 105.24 |
YAPI KREDI EMEKLILIK | 0.02 | 0.00 | 0.02 | 85.42 | 85.44 |
AXA OYAK HAYAT | 4.36 | 31.52 | 35.88 | 35.84 | 71.72 |
BASAK EMEKLILIK | 0.29 | 19.65 | 19.94 | 27.86 | 47.80 |
VAKIF EMEKLILIK | 0.18 | 0.73 | 0.91 | 40.53 | 41.44 |
AMERICAN LIFE HAYAT | 2.83 | 3.88 | 6.71 | 24.85 | 31.56 |
ISVICRE HAYAT | 0.23 | 15.39 | 15.62 | 10.86 | 26.48 |
AK EMEKLILIK | 0.55 | -0.01 | 0.54 | 22.35 | 22.89 |
BAYINDIR HAYAT | 0.43 | 14.53 | 14.96 | 7.12 | 22.08 |
GARANTI EMEKLILIK | 0.00 | 0.00 | 0.00 | 19.90 | 19.90 |
DEMIR HAYAT | 0.12 | 12.42 | 12.54 | 5.19 | 17.73 |
GENEL YASAM | 0.00 | 0.04 | 0.04 | 17.05 | 17.09 |
ANKARA EMEKLILIK | 0.00 | 0.00 | 0.00 | 10.27 | 10.27 |
DOGAN EMEKLILIK | 0.02 | 0.02 | 0.04 | 9.70 | 9.74 |
BIRLIK HAYAT | 0.00 | 0.00 | 0.00 | 3.80 | 3.80 |
GÜVEN HAYAT | 0.00 | 0.00 | 0.06 | 2.27 | 2.33 |
RUMELI HAYAT | 0.01 | 0.05 | 0.06 | 1.14 | 1.20 |
EMEK HAYAT | 0.00 | 0.00 | 0.00 | 0.95 | 0.95 |
TOPRAK (GLOBAL) HAYAT | 0.00 | 0.00 | 0.00 | 0.58 | 0.58 |
SEKER HAYAT | 0.00 | 0.00 | 0.00 | 0.00 | 0.00 |
IHLAS HAYAT | 0.00 | 0.00 | 0.00 | 0.00 | 0.00 |
OYAK EMEKLILIK | 0.00 | 0.00 | 0.00 | 0.00 | 0.00 |
Total | 11.12 | 251.05 | 262.23 | 723.61 | 985.84 |
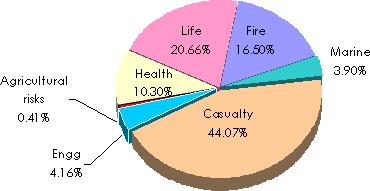
Premiums split by class of business
Exchange rate USD/TRL as at 31/12 | 1999 | 2000 | 2001 | 2002 | 2003 |
542 147.82 | 670 894.14 | 1 440 458.48 | 1 657 289.97 | 1 402 722.09 |
Survey prepared with the kind assistance of Best Re's Istanbul Regional Office with special thanks to Mr. Hafidh Hachani.