United States vs. China: Comparative study of insurance markets
United States vs. China: Evolution of insurance premiums
In billions USD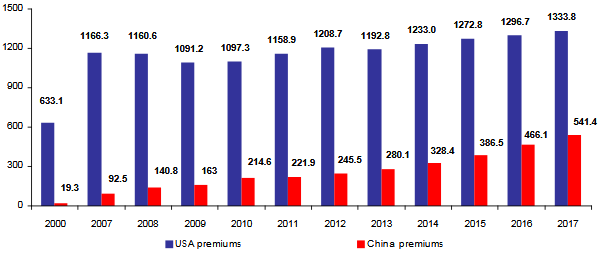
For so long, the American insurance market has topped global ranking, yet its evolution remains less impressive than that of China. For the same period of comparison, that is, 2000-2017, the American market share of global premiums had increased by just 1.85 point with a turnover doubling in 17 years. At the same time, Chinese premiums went 28 fold.
Between 2000 and 2017, the Chinese insurance market reported a growth rate of 2705% against 110% for the United States.
Lagging behind and ranking 16th worldwide in 2000 with 19.28 billion USD of premiums, China popped in at the second position in 2017 with 541.45 billion USD in premiums' collection flow. China’s share of global premiums climbed, therefore, from 0.77% in 2000 to 11% in 2017, that is an improvement of 10.23 points.
Growth of the main indicators
| 1980/2000 evolution | 2000/2017 evolution | |||
|---|---|---|---|---|
| United States | China | United States | China | |
GDP | 259% | 299% | +88.50% | +910.3% |
Number of inhabitants | 24% | +28.64% | +15.43% | +9.27% |
Insurance premiums | 225% | +10 058% | 110% | 2705% |
Global insurance market share | -39.14% | 18 25% | +7.00% | 1 328% |
Penetration rate | +23.53% | 15 800% | -13.9% | 1 78% |
Insurance density | 259% | - | 37% | 2 660% |
United States vs. China: Evolution of insurance premiums (2000-2017)
In billions USD| China | United States | Global premiums | |||
|---|---|---|---|---|---|
| Years | Premiums | % of global premiums | Premiums | % of global premiums | |
| 2000 | 19.28 | 0.77% | 633.140 | 25.42% | 2 490.70 |
| 2007 | 92.46 | 2.24% | 1 166.3 | 28.72% | 4 131.22 |
| 2008 | 140.79 | 3.37% | 1 160.6 | 27.75% | 4 182.39 |
| 2009 | 163.04 | 4% | 1 091.2 | 26.79% | 4 073.52 |
| 2010 | 214.64 | 4.98% | 1 097.3 | 25.46% | 4 309.66 |
| 2011 | 221.91 | 4.86% | 1 158.9 | 25.35% | 4 570.65 |
| 2012 | 245.48 | 5.32% | 1 208.7 | 26.21% | 4 611.07 |
| 2013 | 280.12 | 6.07% | 1 192.8 | 25.97% | 4 611.93 |
| 2014 | 328.44 | 6.87% | 1 233.0 | 25.93% | 4 781.25 |
| 2015 | 386.5 | 8.40% | 1 272.8 | 27.68% | 4 599.85 |
| 2016 | 466.14 | 9.91% | 1 296.7 | 27.57% | 4 702.84 |
| 2017 | 541.45 | 11.07% | 1 333.8 | 27.27% | 4 891.69 |
Source: Atlas Magazine
United States vs. China: Insurance penetration rate (2000-2017)
In 17 years, insurance penetration in China grew by 2.83 points. It is thanks to the improvement of the living standard of the middle class, the launch of mega infrastructure projects and GDP growth that this indicator improved in China.
However, insurance penetration rate in the United States has been declining for several years. From 8.4% reported in 2000, this indicator went down to 7.23% in 2017, that is, a loss of 1.17 point.
The gap between both countries considerably shrunk, going from 6.81 points in 2000 down to 2.81 points in 2017.
| 1980 | 2000 | 2017 | ||||
|---|---|---|---|---|---|---|
| United States | China | United States | China | United States | China | |
Penetration rate | 6.80% | 0.01% | 8.4% | 1.59% | 7.23% | 4.42% |
Insurance premiums in billions USD | 194.7 | 0.19 | 633.1 | 19.3 | 1 333.8 | 541.45 |
Global ranking in terms of insurance premiums | 1st | - | 1st | 16th | 1st | 2nd |
United States vs. China: Evolution of penetration rates
| Years | China | United States | ||||
|---|---|---|---|---|---|---|
| Life (%) | Non life (%) | Total (%) | Life (%) | Non life (%) | Total (%) | |
| 2000 | 0.85 | 0.74 | 1.59 | 4.20% | 4.20% | 8.40% |
| 2007 | 1.65 | 0.95 | 2.6 | 4.70% | 4.70% | 8.90% |
| 2008 | 2.08 | 0.98 | 3.06 | 4.10% | 4.60% | 8.70% |
| 2009 | 2.14 | 1.05 | 3.19 | 3.50% | 4.50% | 8.00% |
| 2010 | 2.34 | 1.17 | 3.51 | 3.50% | 4.50% | 8.00% |
| 2011 | 1.78 | 1.15 | 2.93 | 3.60% | 4.50% | 8.10% |
| 2012 | 1.65 | 1.22 | 2.87 | 3.70% | 4.50% | 8.20% |
| 2013 | 1.6 | 1.32 | 2.92 | 3.20% | 4.30% | 7.50% |
| 2014 | 1.69 | 1.45 | 3.14 | 3.00% | 4.30% | 7.30% |
| 2015 | 1.9 | 1.59 | 3.49 | 3.18% | 4.23% | 7.41% |
| 2016 | 2.35 | 1.82 | 4.17 | 3.02% | 4.29% | 7.31% |
| 2017 | 2.59 | 1.83 | 4.42 | 3.12% | 4.11% | 7.23% |
Sources: Sigma, Swiss Re and Atlas Magazine
United States vs. China: Insurance density evolution (2000-2017)
In the United States, insurance density was set at 4216 USD in 2017. An American citizen consumed 3802 USD more in insurance than a Chinese citizen, a gap that was set at 3061 USD in 2000.
In China, insurance density skyrocketed from 15 USD in 2000 up to 414 USD in 2017. Despite this huge progression, the per-capita insurance consumption remains well below global average set at 650 USD per capita.
Unlike the evolution of other indicators, China has not caught up with the United States in terms of insurance density. Contrarily, it is the United States that widened the gap between both countries.
| 1980 | 2000 | 2017 | ||||
|---|---|---|---|---|---|---|
| United States | China | United States | China | United States | China | |
Insurance density in USD | 857 | - | 3 076 | 15 | 4216 | 414 |
Evolution of insurance density in the United States and China
In USD| Years | China | United States | ||||
|---|---|---|---|---|---|---|
| Life | Non life | Total | Life | Non life | Total | |
| 2000 | 8 | 7 | 15 | 1 547 | 1 529 | 3 076 |
| 2007 | 44.2 | 25.5 | 69.7 | 1 922 | 2 164 | 4 086 |
| 2008 | 71.7 | 33.7 | 105.4 | 1 900.6 | 2 177.4 | 4 078 |
| 2009 | 81.1 | 40 | 121.1 | 1 602.6 | 2 107.3 | 3 709.9 |
| 2010 | 105.5 | 52.9 | 158.4 | 1 631.8 | 2 127.2 | 3 759 |
| 2011 | 99 | 64 | 163 | 1 716 | 2 130 | 3 846 |
| 2012 | 103 | 76 | 179 | 1 808 | 2 239 | 4 047 |
| 2013 | 110 | 91 | 201 | 1 684 | 2 296 | 3 980 |
| 2014 | 127 | 109 | 236 | 1 657 | 2 360 | 4 017 |
| 2015 | 153.1 | 127.6 | 280.7 | 1 719.2 | 2 376.6 | 4 095.8 |
| 2016 | 189.9 | 147.2 | 337.1 | 1 724.9 | 2 449.2 | 4 174.1 |
| 2017 | 255 | 159 | 414 | 1 674 | 2 542 | 4 216 |
Sources: Sigma, Swiss Re and Atlas Magazine
United States vs. China: Life and non-life premiums and market shares (1980-2017)
Like big developed markets in China as well as in the United States, the turnover combining life and non-life insurance has been gradually coming to balance, with life activity largely growing in both countries at the detriment of the non-life business.
In the course of the 1980-2017 period, non-life premiums have been on constant decline for both countries. During the same period, the life market grew by 18.24 points in the United States, thus rising from 33.59% to 51.83%. Only in 2000 did this class of business go beyond the 50% bar. The non-life market share in the United States declined from 66.41% to 48.17%.
In China, life insurance was practically inexistent in the 1980s. Today, it is reporting 54.53% of the overall premiums. The non-life market share in China decreased from 100% in 1980 to 41.35% in 2017.
Life insurance in the United States and China
In billions USD| China | United States | |||
|---|---|---|---|---|
| Premiums | Market shares | Premiums | Market shares | |
| 1980 | - | - | 65.404 | 33.59% |
| 1990 | 1.180 | 37.46% | 209.612 | 40.99% |
| 2000 | 10.280 | 53.32% | 436.378 | 50.28% |
| 2007 | 58.670 | 63.45% | 666.719 | 57.16% |
| 2008 | 95.810 | 68.05% | 661.930 | 57.03% |
| 2009 | 109.170 | 66.96% | 608.133 | 55.73% |
| 2010 | 143.010 | 66.63% | 612.940 | 55.86% |
| 2011 | 134.570 | 60.64% | 656.926 | 56.68% |
| 2012 | 141.190 | 57.52% | 684.847 | 56.66% |
| 2013 | 153.300 | 54.73% | 646.631 | 54.21% |
| 2014 | 176.950 | 53.88% | 662.283 | 53.71% |
| 2015 | 210.760 | 54.53% | 681.078 | 53.51% |
| 2016 | 262.620 | 56.34% | 683.353 | 52.70% |
| 2017 | 317.570 | 58.65% | 691.375 | 51.83% |
Source: Atlas Magazine
Non-life insurance in the United States and China
In billions USD| China | United States | |||
|---|---|---|---|---|
| Premiums | Market shares | Premiums | Market shares | |
| 1980 | 0.190 | 100% | 129.332 | 66.41% |
| 1990 | 1.970 | 62.54% | 301.819 | 59.01% |
| 2000 | 9 | 46.68% | 431.545 | 49.72% |
| 2007 | 33.790 | 36.55% | 499.616 | 42.84% |
| 2008 | 44.980 | 31.95% | 498.691 | 42.97% |
| 2009 | 53.870 | 33.04% | 483.081 | 44.27% |
| 2010 | 71.630 | 33.37% | 484.404 | 44.14% |
| 2011 | 87.340 | 39.36% | 502.005 | 43.32% |
| 2012 | 104.290 | 42.48% | 523.882 | 43.34% |
| 2013 | 126.820 | 45.27% | 546.250 | 45.79% |
| 2014 | 151.490 | 46.12% | 570.783 | 46.29% |
| 2015 | 175.740 | 45.47% | 591.758 | 46.49% |
| 2016 | 203.520 | 43.66% | 613.362 | 47.30% |
| 2017 | 223.880 | 41.35% | 642.480 | 48.17% |
Source: Atlas Magazine