CIMA’s non-life insurance market
 The volume of non-life insurance premiums grew from 531 billion FCFA (1.025 billion USD) in 2011 to 885 billion FCFA (1.656 billion USD) in 2020, an increase of 67% over the period. The three main markets of the CIMA zone alone, Côte d'Ivoire, Cameroon and Senegal, account for 57% of non-life premiums.
Over the past ten years, Burkina Faso has posted the strongest growth in non-life premiums (+137%), followed by Côte d'Ivoire (+117%) and Mali (+93%).
Read also | CIMA zone insurance market
CIMA’s non-life insurance premiums per country
In millions USD
| 2011 | 2015 | 2020 | 2011/2020 evolution (1) | 2020 shares | |
|---|---|---|---|---|---|
| Côte d'Ivoire | 204 | 272 | 429 | 117% | 26% |
| Cameroon | 204 | 218 | 263 | 33% | 16% |
| Senegal | 137 | 144 | 249 | 88% | 15% |
| Burkina Faso | 149 | 169 | 153 | 6% | 9% |
| Gabon | 50 | 65 | 116 | 137% | 7% |
| Togo | 68 | 150 | 100 | 51% | 6% |
| Benin | 42 | 47 | 79 | 93% | 5% |
| Congo Brazzaville | 45 | 48 | 71 | 65% | 4% |
| Mali | 48 | 54 | 68 | 46% | 4% |
| Niger | 33 | 40 | 54 | 65% | 3% |
| Equatorial Guinea | 23 | 26 | 37 | 68% | 2% |
| Chad | 15 | 22 | 24 | 64% | 1% |
| Central African Republic | 7 | 5 | 11 | 61% | 1% |
| Guinea Bissau | - | - | 2 | - | 0% |
| Total | 1 025 | 1 260 | 1 656 | 67% | 100% |
(1) Evolution in FCFA
CIMA’s non-life premiums per class of business
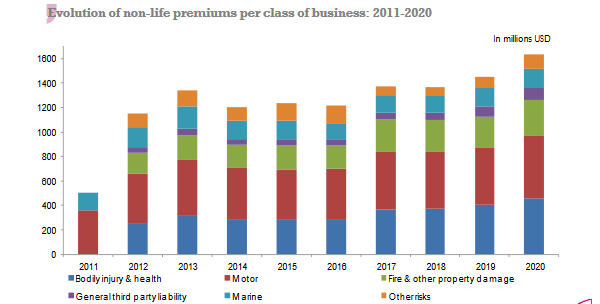
As in most African countries, motor insurance is predominant in the CIMA region, accounting for 31% of non-life premiums, followed by bodily injury and health insurance (27.5%) and fire and other property damage (17.5%).
In terms of growth, with the exception of non-life acceptances, where production remains marginal, and marine (14%), motor insurance is one of the schemes that have grown the least over the last ten years (+48%).
Conversely, the fastest growing classes of business over the last ten years have been general third-party liability (+157%), bodily injury & health (108%) and fire & other property damage (85%).
In millions USD
| Classes of business | >Bodily injury & health | Motor | Fire & other property damage | General third party liability | Marine | Other risks | Non-life acceptances | Total non-life |
|---|---|---|---|---|---|---|---|---|
| 2020 | 455 | 515 | 289 | 103 | 156 | 115 | 23 | 1 656 |
| 2019 | 408 | 464 | 252 | 88 | 150 | 87 | 18 | 1 467 |
| 2018 | 371 | 468 | 258 | 58 | 138 | 74 | 17 | 1 384 |
| 2017 | 364 | 475 | 263 | 52 | 144 | 72 | 13 | 1 383 |
| 2016 | 290 | 409 | 187 | 46 | 131 | 150 | 17 | 1 230 |
| 2015 | 282 | 408 | 197 | 50 | 157 | 141 | 25 | 1 260 |
| 2014 | 284 | 423 | 186 | 47 | 154 | 108 | 39 | 1 241 |
| 2013 | 311 | 461 | 204 | 53 | 181 | 131 | 37 | 1 378 |
| 2012 | 258 | 404 | 171 | 44 | 165 | 110 | 25 | 1 177 |
| 2011 | 226 | 360 | 161 | 41 | 141 | 72 | 24 | 1 025 |
| 2020 shares | 27.49% | 31.12% | 17.46% | 6.22% | 9.43% | 6.95% | 1.33% | 100% |
| 2011-2020 evolution (1) | 108% | 48% | 85% | 157% | 14% | 65% | -6% | 67% |
(1) Evolution in FCFA

CIMA’s non-life loss experience
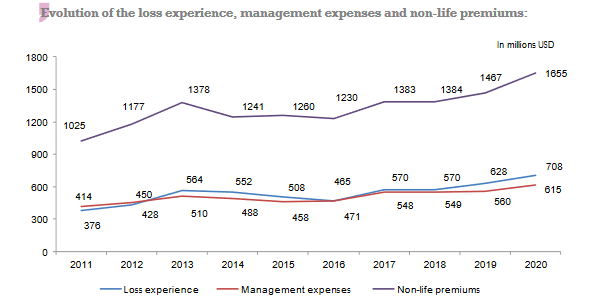
Expressed in local currency, the non-life claims cost has increased by 94% from 2011 to 2020 while at the same time the non-life premium volume has increased by only 67%. This trend in premium and loss ratios indicates a deterioration in the underwriting balance, which is expressed by a 4.5-point loss in the loss ratio.
The loss ratio in the CIMA zone, which rarely exceeds 50%, is significantly lower than that reported in developed countries and in the rest of Africa.
In terms of claims experience, the weakness of the CIMA zone lies not in its claims ratio but in the slowness of settlement periods. This slowness was behind the establishment of CIMA, one of whose priorities is to clean up claims outstanding settlements. The reforms introduced by the CRCA have reduced the average time to pay a claim from 2.27 years in 2011 to 1.52 years in 2020 for non-life insurance.
CIMA’s non-life loss ratio
As mentioned earlier, the claims experience remains moderate in the CIMA zone, with little exposure to natural catastrophes. The average loss ratio is 43.1% in 2020. It was 37.2% ten years earlier. Only two countries in the zone have a loss ratio above 50% in 2020: Senegal (52.7%) and Côte d'Ivoire (51.4%).
In millions USD
| Non-life incurred losses | Non-life earned premiums | Loss ratio | |
|---|---|---|---|
| 2020 | 708 | 1 641 | 43.10% |
| 2019 | 628 | 1 455 | 43.20% |
| 2018 | 570 | 1 370 | 41.70% |
| 2017 | 570 | 1 360 | 41.90% |
| 2016 | 465 | 1 199 | 38.80% |
| 2015 | 508 | 1 234 | 41.20% |
| 2014 | 552 | 1 278 | 43.20% |
| 2013 | 564 | 1 358 | 41.60% |
| 2012 | 428 | 1 160 | 36.90% |
| 2011 | 376 | 1 012 | 37.20% |
CIMA’s non-life management expenses
Management costs are the major downside of French-speaking West and Central Africa. Thanks to CIMA's efforts, these costs (overheads and commissions) have gradually declined from 2011 to the present. From 40% in 2011, they fell down to 37% in 2020, a decline of 8% in ten years. The top two countries in the zone in 2020, Côte d'Ivoire and Senegal, are among those that have been most successful in reducing this rate, from 45% to 36% and from 42.5% to 37.2% respectively between 2011 and 2020.
Despite their improvement, management expense ratios in the CIMA zone remain significantly higher than those posted in other markets.
CIMA’s management expenses ratio
In millions USD
| Commissions | overhead expenses | Total non-life management expenses | Non-life written premiums | Management expenses ratio | |
|---|---|---|---|---|---|
| 2020 | 217 | 397 | 615 | 1 655 | 37.10% |
| 2019 | 197 | 363 | 560 | 1 467 | 38.20% |
| 2018 | 191 | 358 | 549 | 1 384 | 39.70% |
| 2017 | 186 | 362 | 548 | 1 383 | 39.60% |
| 2016 | 160 | 311 | 471 | 1 230 | 38.30% |
| 2015 | 159 | 300 | 458 | 1 260 | 36.40% |
| 2014 | 165 | 323 | 488 | 1 241 | 39.30% |
| 2013 | 170 | 339 | 510 | 1 378 | 37.00% |
| 2012 | 147 | 303 | 450 | 1 177 | 38.20% |
| 2011 | 130 | 284 | 414 | 1 025 | 40.30% |

CIMA’s non-life combined ratio
Thanks to a relatively low claims experience, CIMA countries have managed to keep the combined ratio within a range of 75% to 82% over the past ten years, resulting in a comfortable technical margin.
Over the last five years, from 2016 to 2020, the combined ratio has not exceeded 81.5%, with Senegal (89.9%), Côte d'Ivoire (87.4%) and Benin (87.5%) showcasing the highest combined ratios in 2020.
In million USD
| Loss ratio | Management expenses ratio | Combined ratio | |
|---|---|---|---|
| 2020 | 43.10% | 37.10% | 80.20% |
| 2019 | 43.20% | 38.20% | 81.40% |
| 2018 | 41.70% | 39.70% | 81.40% |
| 2017 | 41.90% | 39.60% | 81.50% |
| 2016 | 38.80% | 38.30% | 77.10% |
| 2015 | 41.20% | 36.40% | 77.60% |
| 2014 | 43.20% | 39.30% | 82.50% |
| 2013 | 41.60% | 37.00% | 78.60% |
| 2012 | 36.90% | 38.20% | 75.10% |
| 2011 | 37.20% | 40.30% | 77.50% |
Read also | CIMA’s life insurance market
