Ping An Insurance: position of the group in China and in the world
Ping An Insurance as of 31/12/2021:
- A Chinese holding company with subsidiaries in the fields of insurance, banking, asset management, finance, health and technology,
- A group turnover, all activities combined, of 1 288 billion CNY (202 billion USD),
- A life and non-life insurance turnover of 760.843 billion CNY (119.376 billion USD),
 The second largest insurance company in the world in terms of premiums behind the American UnitedHealth Group,
- The 17th largest company in the world (1),
- Total group assets of 10 140 billion CNY (1 591 billion USD),
- A group net profit of 121.802 billion CNY (19.111 billion USD),
- A net insurance profit of 76.495 billion CNY (12 billion USD),
- A workforce of 355 982 employees,
- 227 million clients,
- 647 million internet users (2).
(1) 2022 Forbes rating
(2) Users of Ping An online services
Ping An Insurance : capital and shareholding
As of December 31, 2021, the Ping An Insurance Group's capitalization amounted to 18,28 million CNY (2.8 billion USD). The capital has increased 255 times since the company was founded in 1988.
Figures in millions
| 2021 | 2012 | 1988 | ||||
|---|---|---|---|---|---|---|
| CNY | USD | CNY | USD | CNY | USD | |
| Share capital 2021 (SC) | 18 280 | 2 868 | 7 916 | 1 253 | 42 | 11 |
| Shareholders’ equity 2021 (SE) | 812 405 | 127 466 | 159 617 | 25 271 | - | - |
| SC/SE 2021 | 2.25% | 4.96% | - | |||
Ping An’s Insurance main shareholders
The group’s shareholder structure is relatively dispersed, with shareholders of Chinese origin controlling the vast majority of the capital and with Hong Kong Securities Clearing Company Nominees Limited standing as the largest shareholder with a 37.01% stake.
| Major shareholders | In % |
|---|---|
| Hong Kong Securities Clearing Company Nominees Limited | 37.01% |
| Shenzhen Investment Holdings Co., Ltd. | 5.27% |
| Hong Kong Securities Clearing Company Limited | 3.65% |
| China Securities Finance Corporation Limited | 2.99% |
| Central Huijin Asset Management Ltd | 2.57% |
| Business Fortune Holdings Limited | 2.34% |
| Shum Yip Group Limited | 1.41% |
| Plenty Ace Investments (SPV) Limited | 1.20% |
| Dacheng Fund – Agricultural Bank of China – Dacheng Zhongzheng Financial Asset Management Plan | 1.10% |
| Huaxia Fund – Agricultural Bank of China – Huaxia Zhongzheng Financial Asset Management Plan | 1.09% |
Ping An Insurance: breakdown of the group’s operations
Despite the group's diversification, insurance (life and non-life) remained Ping An's main source of revenue in 2021, accounting for 59.1%. Financial operations: banking and asset management totaled 56 140 million USD (27.8%).
The remaining 13.1% of the revenue comes from technology activities.
Figures in millions USD
| Year | Life and non-life insurance premiums | Banking activities | Asset management | Other activities | Total | % of insurance |
|---|---|---|---|---|---|---|
| 2021 | 119 376 | 42 135 | 14 005 | 26 520 | 202 036 | 59.10% |
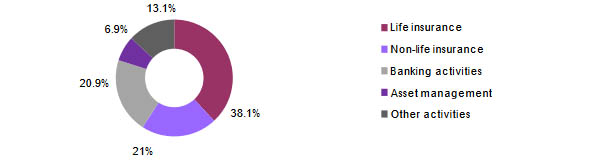
Breakdown of turnover 2021 by activity
Within the group, life and health account for 38.1% of total revenues, all activities combined (banking, insurance, asset management, technology, etc.). With 21%, non-life ranks second in the group.
Breakdown of insurance activities within the group
From the outset, Ping An has focused on life and health insurance products, the two huge premium pools that it has been able to tap into thanks to new technologies.
By the end of 2021, the group achieved 77 billion USD in life premiums, that is, 20.8% of the local market and 64.4% of the group's total life and non-life insurance premiums.
Ping An Insurance’s position in China
Despite the opening of the market to foreign insurers, the Chinese insurance landscape remains strongly dominated by four national giants:
- Ping An,
- China Life,
- PICC,
- China Pacific Insurance.
In 2021, they accounted for 53.5% of the local market. Foreign companies, led by AXA Tianping, a wholly-owned subsidiary of AXA, are not among the market leaders.
Figures in millions
| Companies | Type of activity | 2021 premiums | ||
|---|---|---|---|---|
| CNY | USD | Shares | ||
| Ping An | Life and non-life | 760 843 | 119 376 | 16.90% |
| China Life | Life | 618 327 | 97 016 | 13.80% |
| People's Insurance Company of China (PICC) | Life and non-life | 585 425 | 91 853 | 13% |
| China Pacific Insurance | Life | 436 331 | 68 460 | 9.70% |
| Total | 2 400 926 | 376 705 | 53.50% | |
| Rest of the market | 2 089 074 | 327 776 | 46.50% | |
| Total Chinese market | 4 490 000 | 704 481 | 100% | |
Ping An accounts for 16.9% of the Chinese life and non-life market.
Several factors contribute to the group's position in the local market. In fact, the same factors that contributed to Ping AN's emergence in the first place are also contributing to this positioning, namely:
- the steady GDP growth and the emergence of a middle class in China,
- the gradual disengagement of local authorities from social protection programs,
- the increased risk awareness of the insured,
- the impact of new technologies on the distribution of insurance products,
- the development of an innovative ecosystem,
- the rapid digitalization,
- the bank-insurance rapprochement.
Ping An Group’s worldwide position
With 202 billion USD in revenues, Ping An was by the end of 2021 the second largest insurance group worldwide. The Chinese holding company ranks behind the American UnitedHealth Group, specialized in health insurance.
Apart from health, Ping An is the world's leading life and non-life group, the classes of business where it outpaced the traditional giants of the market, Axa, Allianz, Generali and State Farm.
Read also | Top 30 insurers in the world
Ping An: 2012-2021 evolution
In 2021, Ping An's insurance premiums fell for the first time in over a decade. Premium collection was affected by the economic slowdown and the resulting decline in consumer spending.
Another important factor is that the group has developed a policy based on the reduction of its direct sales outlets in recent years, a strategy that has also contributed to the drop in the 2021 revenues.
Figures in millions USD
| Year | Chinese market | Ping An premiums | |||||
|---|---|---|---|---|---|---|---|
| Life and non-life | Total market share | Life | Life market share | Non-life | Non-life market share | ||
| 2021 | 704 481 | 119 376 | 16.90% | 76 926 | 20.80% | 42 450 | 12.68% |
| 2020 | 655 865 | 122 243 | 18.64% | 78 371 | 22.55% | 43 872 | 14.23% |
| 2019 | 617 399 | 113 774 | 18.40% | 74 938 | 22.75% | 38 836 | 13.49% |
| 2018 | 574 890 | 104 616 | 18.20% | 68 580 | 21.88% | 36 036 | 13.78% |
| 2017 | 541 446 | 92 903 | 17.20% | 59 676 | 18.79% | 33 227 | 14.84% |
| 2016 | 466 131 | 67 569 | 14.50% | 41 913 | 15.96% | 25 656 | 12.61% |
| 2015 | 386 500 | 59 473 | 15.40% | 34 212 | 16.23% | 25 261 | 14.37% |
| 2014 | 328 439 | 53 047 | 16.15% | 29 784 | 16.83% | 23 263 | 15.36% |
| 2013 | 280 119 | 44 006 | 15.70% | 25 086 | 16.36% | 18 920 | 14.92% |
| 2012 | 245 363 | 37 037 | 15.09% | 21 349 | 15.13% | 15 688 | 15.05% |
Sources: Sigma, Swiss Re Institute, Ping An.
