Cost of natural disasters at the global level
 According to a report entitled Aquanomics published by GHD, an engineering and architecture consultancy, the worsening of natural disasters, mainly those related to water (extreme temperatures, floods and heavy weather), could lead to losses estimated at 5 600 billion USD for the world economy by 2050
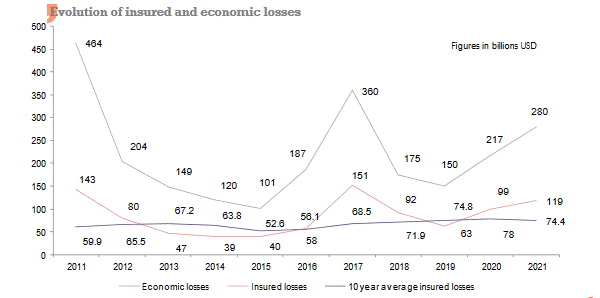
These disasters already cost hundreds of billions USD per year. According to Swiss Re, for the year 2021 alone, the economic losses generated by this type of event have reached 280 billion USD.
Read also | Top 10 costliest natural catastrophes in 2022
Natural disasters: evolution in the number of events, casualties and losses
| Number of events | Number of casualties | Economic losses (1) | Insured losses (1) | 10 year average insured losses (1) | Coverage gap (1) | |
|---|---|---|---|---|---|---|
| H1 2022 | - | 4 300 | 72 | 35 | 29 (H1 2013 - H1 2022) | 37 |
| 2021 | 306 | 11 881 | 280 | 118.8 | 74.4 (2012-2021) | 161.2 |
| 2020 | 274 | 79 993 | 217 | 99 | 78 (2011-2020) | 118 |
| 2019 | 317 | 11 497 | 150 | 63 | 74.8 (2010-2019) | 87 |
| 2018 | 304 | 13 542 | 175 | 92 | 71.9 (2009-2018) | 83 |
| 2017 | 307 | 11 474 | 360 | 151.4 | 68.5 (2008-2017) | 208.6 |
| 2016 | 335 | 10 841 | 187 | 58 | 56.1 (2007-2016) | 129 |
| 2015 | 357 | 26 543 | 101 | 40 | 52.6 (2006-2015) | 61 |
| 2014 | 344 | 12 914 | 120 | 39 | 63.8 (2005-2014) | 81 |
| 2013 | 327 | 27 063 | 149 | 47 | 67.2 (2004-2013) | 102 |
| 2012 | 326 | 14 007 | 204 | 80 | 65.5 (2003-2012) | 124 |
| 2011 | 341 | 34 072 | 464 | 143 | 59.9 (2002-2011) | 321 |
(1) in billions USD
Source : Swiss Re Institute

The main consequences of global warming can be summarized as follows:
- lasting economic disruption with long-term consequences,
- massive population displacement to places less vulnerable to natural disasters,
- severe impact of the frequency of drought episodes on agricultural production. The sector can no longer keep afloat, posing a threat to global food security,
- disruption of supply chains especially those operating across waterways due to drying up of rivers,
- long-term destruction of the ecosystem. It takes twenty to thirty years to rebuild a forest and the activities that depend on it once an area is scorched by fire.
According to Swiss Re, climate disruption has become a real threat to the future. In Europe, the heat wave and the historic summer of 2022 could precipitate a recession. Due to global warming, the European Central Bank is already forecasting a 4% loss of economic growth by 2030 in the Eurozone.
Natural disasters: economic and insured losses in 2021
Figures in billions USD| Number of events | Number of casualtiess | Shares in % | Insured losses | Shares in % | Economic losses | Shares in % | |
|---|---|---|---|---|---|---|---|
| North America | 87 | 1 451 | 12.2 | 81.3 | 68.4 | 148.5 | 53 |
| Latin America and the Caribbean | 21 | 2 877 | 24.2 | 1 | 0.8 | 5.7 | 2 |
| Europe | 36 | 633 | 5.3 | 22.2 | 18.7 | 59 | 21.1 |
| Africa | 58 | 2 554 | 21.5 | 2.3 | 1.9 | 3.7 | 1.3 |
| Asia | 92 | 4 094 | 34.5 | 9.6 | 8.1 | 58.6 | 20.9 |
| Australia & Oceania | 12 | 272 | 2.3 | 2.4 | 2 | 4.5 | 1.6 |
| Total World | 306 | 11 881 | 100 | 118.8 | 100 | 280 | 100 |
Source : Swiss Re Institute
Natural disasters in 2022: insured losses on the rise
Losses resulting from extreme weather conditions are on the rise in the first half of 2022. According to Munich Re's estimates, the total insured losses have reached 35 billion USD by the end of June 2022. Storms and floods in Australia, Europe and the United States alone account for more than 35% of total losses.
For the whole year 2022, analysts are expecting a record loss ratio. The various meteorological phenomena that occurred in the four corners of the globe during the summer season should inflate the half-yearly bill, which is already higher than the average of the last ten years (29 billion USD).
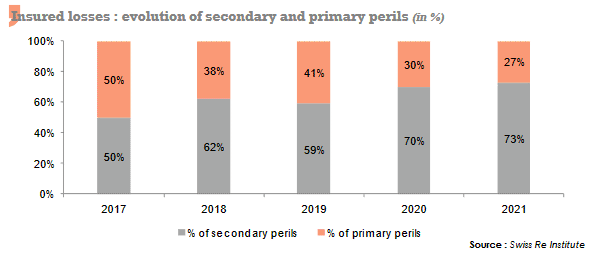
This upward trend has been confirmed particularly for the last five years with the multiplication of secondary perils. In fact, these hazards affect even more populations and regions, leading to increasingly high insured losses.
In addition, the increase in secondary perils and the occurrence of one or more major events, such as a devastating hurricane or a strong earthquake during the same year, would have a significant impact on the market. Faced with this situation, the insurance industry is now launching a wake-up call: the accumulation of losses would weigh heavily on the profitability of the profession.
Natural disasters: breakdown of insured losses by type of peril (2017-2021)
The table below breaks down insured losses based on the type of perils (secondary and primary over a five-year period: 2017-2021. Total losses exclude damage resulting from man-made events.
As a reminder, primary perils are natural disasters that cause significant losses to the insurance industry. Secondary perils are the after-effects of a primary peril or medium-sized events, related to global warming.
Figures in billions USD| Secondary perils | Shares in % | Primary perils | Shares in % | Total insured losses (1) | |
|---|---|---|---|---|---|
| 2021 | 81 | 73% | 30 | 27% | 111 |
| 2020 | 63 | 70% | 30 | 30% | 93 |
| 2019 | 31.9 | 59% | 22.5 | 41% | 54.4 |
| 2018 | 47.5 | 62% | 29 | 38% | 76.5 |
| 2017 | 72 | 50% | 71 | 50% | 143 |
(1) Excluding man-made catastrophes

According to AIR Worldwide, a company specialized in risk modeling, the insurance industry should expect an average annual bill of nearly 110 billion USD related to natural catastrophes over the long term. The average bill of the last decade amounted to 75 billion USD. With climate disruption, AIR Worldwide anticipates losses that could exceed the forecasts and climb up to 200 billion USD on average per year over the next ten years.
Faced with the increase of Nat Cat, the market players are deploying different strategies:
- Reducing or eliminating exposure to risks. This is the case for Axis, Axa XL, RenaissanceRe, ... who are re-evaluating their risks and judging that premiums have remained insufficient in the face of rising claims. Such an option is expected to reduce the supply of coverage and drive-up rates.
- The development of the Nat Cat portfolio following the example of Munich Re, Swiss Re,... Considering this niche as "a business opportunity", this player profile is supported by a solid position within the market, good expertise in risk, financial strength, portfolio diversification and a broad client base.
- The increase in insurance and reinsurance rates for the class of business.
- The revision of indemnification criteria such as the exclusion of purely cosmetic or superfluous damage.
- The development of other solutions such as parametric insurance that is automatically triggered as soon as certain predefined conditions are met. Example: the drop in river water levels during drought episodes.
- Encouraging natural disasters prevention and mitigation measures such as banning construction in high-risk areas. Occurring in Louisiana 16 years after Katrina, Hurricane Ida cost insurers only 13.1 billion USD, that is, nearly five times less than Katrina (61 billion USD) despite an equivalent intensity.
Read also | Fires and forest fires in 2022
Natural disasters: breakdown of insured losses per type of event (2017-2021)
The table below shows all the losses by type of event, including the losses due to man-made catastrophes.
Figures in billions USD| Earthquake | Hurricane | Flooding | Strong bad weather | Fires | Other perils (1) | Total insured losses | |
|---|---|---|---|---|---|---|---|
| 2021 | 3,9 | 34,7 | 20,2 | 28,8 | 4,4 | 26,8 | 118,8 |
| 2020 | - | 26,8 | 7,2 | 42,1 | 12,2 | 10,7 | 99 |
| 2019 | - | 23,7 | 4,4 | 23,5 | 2,7 | 8,7 | 63 |
| 2018 | 2,8 | 39 | 4,8 | 21,6 | 18,3 | 5,5 | 92 |
| 2017 | 1,8 | 106,9 | 2,6 | 23 | 17,1 | - | 151,4 |
(1) Including man-made catastrophes as well
Source : Swiss Re Institute
