Magazine date:
Jul 2005 Non life insurance premiums in 2004
in thousands USD| Motor | Fire | Marine | Health | Personal Accidents | Engineering | Other | Total | |
|---|---|---|---|---|---|---|---|---|
AXA | 4 994.41 | 3 888.04 | 13 211.60 | 1 814.83 | 88.75 | 194.25 | 834.21 | 25 026.09 |
PA | 5 277.44 | 1 528.66 | 1 683.98 | 2 413.52 | 111.30 | 225.44 | 494.84 | 11 735.17 |
SONAM | 2 150.96 | 2 706.13 | 1 508.11 | 3 012.90 | 227.99 | 461.66 | 1 039.45 | 11 107.20 |
AGS | 4 044.94 | 1 740.86 | 967.59 | 1 573.54 | 146.70 | 535.14 | 1 085.70 | 10 094.47 |
AGF Sén | 2 908.88 | 2 663.70 | 1 128.17 | 1 659.17 | 59.50 | 418.55 | 1 016.39 | 9 854.36 |
ASS | 6 543.10 | 56.09 | 12.9 | 259.49 | 8.25 | 0.00 | 345.77 | 7 225.60 |
SOSAR | 3 267.70 | 809.05 | 210.21 | 1 065.73 | 38.29 | 242.74 | 714.06 | 6 347.79 |
CNART | 5 202.46 | 448.34 | 192.38 | 181.58 | 127.15 | 68.14 | 68.56 | 6 288.62 |
ALLIANCE | 3 431.99 | 538.42 | 487.36 | 1 283.71 | 165.48 | 150.50 | 230.38 | 6 287.85 |
NSIA-Sén | 2 217.07 | 806.91 | 683.19 | 1 233.23 | 79.97 | 277.52 | 412.00 | 5 709.89 |
SONAC | - | - | - | - | - | - | 1 050.15 | 1 050.15 |
MAAS | 243.78 | 79.61 | 4.05 | 1.79 | 329.23 | |||
Total | 40 282.73 | 15 265.83 | 20 085.49 | 14 497.70 | 1 057.43 | 2 573.94 | 7 293.30 | 101 056.42 |
Non life premiums' evolution split by company 2003-2004
in thousands USD| 2004 | 2003 | |||
|---|---|---|---|---|
| Total | Market share | Total | Market share | |
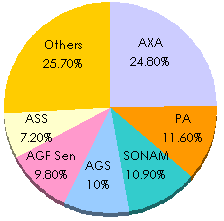
AXA | 25 026.09 | 24.8% | 18 237.90 | 23.7% |
PA | 11 735.17 | 11.6% | 9 145.82 | 11.9% |
SONAM | 11 107.20 | 10.9% | 9 215.18 | 12.0% |
AGS | 10 094.47 | 10.0% | 8 535.52 | 11.1% |
AGF Sén. | 9 854.36 | 9.8% | 8 070.86 | 10.5% |
ASS | 7 225.60 | 7.2% | 6 798.25 | 8.8% |
SOSAR | 6 347.79 | 6.3% | 4 311.97 | 5.6% |
CNART | 6 288.62 | 6.2% | 4 220.08 | 5.5% |
ALLIANCE | 6 287.85 | 6.2% | 4 551.24 | 5.9% |
NSIA-Sén | 5 709.89 | 5.7% | 2 949.20 | 3.8% |
SONAC | 1 050.15 | 1.0% | 693.52 | 0.9% |
MAAS | 329.23 | 0.3% | 247.93 | 0.3% |
Total | 101 056.42 | 100% | 76 977.47 | 100% |
Life insurance premiums in 2004
in thousands USD| Individual policies | Group life | Total 2004 | % | Total 2003 | % | |||||
|---|---|---|---|---|---|---|---|---|---|---|
| Death* | Pension | Total | Death* | Pension | Total | |||||
| Limited companies | ||||||||||
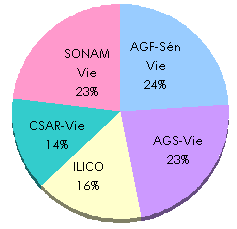
AGF-Sén Vie | 811.2 | 2 890.3 | 3 701.5 | 168.9 | 391.6 | 560.5 | 4 262.0 | 24% | 3 721.8 | 26% |
AGS-Vie | 308.1 | 551.4 | 859.5 | 983.1 | 2 338.5 | 3 321.6 | 4 181.1 | 23% | 2 153.8 | 15% |
ILICO | 1 015.1 | 1 165.1 | 2 180.2 | 494.9 | 169.7 | 664.6 | 2 844.8 | 16% | 2 674.7 | 19% |
CSAR-Vie | 408.0 | 11.2 | 419.2 | 1 436.7 | 605.0 | 2 041.7 | 2 460.9 | 14% | 2 204.7 | 15% |
Total | 2 542.4 | 4 618.0 | 7 160.4 | 3 083.6 | 3 504.8 | 6 588.4 | 13 748.8 | 76% | 10 755.0 | 75% |
| Mutuals | ||||||||||
SONAM Vie | 401.6 | 608.7 | 1 010.3 | 2 725.6 | 491.3 | 3 216.9 | 4 227.2 | 23% | 3 593.8 | 25% |
Grand total | 2 944.0 | 5 226.7 | 8 170.7 | 5 809.2 | 3 996.1 | 9 805.3 | 17 976.0 | 100% | 14 348.8 | 100% |
Non life premiums split by company | Life premiums split by company |
 |  |
Special thanks to FFSA (Fédération Sénégalaise des Sociétés d'Assurances) for its kind assistance on this survey.