Magazine date:
Apr 2006 
Insurance market features
- Regulatory authority: Ministry of Finance, Federal Insurance Supervisory Service
- Premiums (2005): 17.05 billion USD
- Insurance density (2005):
119.23 USD - Penetration rate (2005): 2.27 %
Market structure in 2005
Actors | Number |
|---|---|
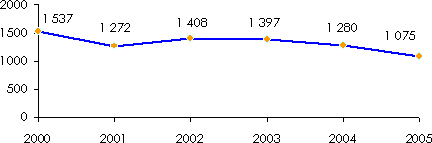
Insurance companies | 1 075 |
Reinsurance companies | 42 |
Brokers | 1 269 |
Identity
- Area: 17 075 200 Km2
- Population (2005):143 000 000 inhabitants
- GDP (2005): 752 billion USD
- GDP per capita: 5 258 USD
- GDP growth rate (2005): 6.4%
- Inflation rate :10.9%
- Main economic sectors: crude oil, natural gas, coal, electric power generating and transmitting equipment, metals, chemicals and fertilizers, rubber, cellulose, wood, advanced electronic components, agricultural machinery, textiles, food-stuffs
Major cities
(in number of inhabitants)
- Moscow (capital): 10.1 million
- Saint-Petersburg: 4.7 million
- Novosibirsk: 1.4 million
- Nizhniy Novgorod: 1.3 million
Number of insurance companies: 2000-2005
Turnover evolution: 2000-2005
in billions USD/RUR| Written premiums | 2000 | 2001 | 2002 | 2003 | 2004 | 2005 | 2004/2005 Growth rate |
|---|---|---|---|---|---|---|---|
| USD | 6.07 | 9.17 | 9.45 | 14.68 | 16.99 | 17.05 | + 0.35% |
| RUR | 171 | 276.6 | 300.4 | 432.4 | 471.6 | 490.6 | - |
Average turnover by company: 2000-2005
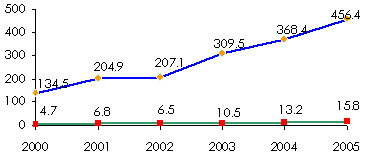
in millions RUR
in millions USD
Life and non-life turnovers of the top 20 insurance companies of the market in 2005*
in thousands RUR/USDCompany | Premiums in RUR | Premiums in USD | Market shares |
|---|---|---|---|
ROSGOSSTRAKH | 35 928 200 | 1 248 300 | 10% |
INGOSSTRAKH | 24 971 200 | 867 500 | 7% |
RESO-GARANTIA | 23 307 400 | 809 800 | 7% |
SOGAZ | 14 778 600 | 513 500 | 4% |
ROSNO | 11 417 600 | 396 700 | 3% |
VSK | 9 202 300 | 319 700 | 3% |
SOGLASIE | 8 708 500 | 302 600 | 2% |
ZHASO | 6 886 700 | 239 300 | 2% |
ALPHASTRAKHOVANIE | 6 683 300 | 232 200 | 2% |
URALSIB | 6 604 200 | 229 500 | 2% |
MAKS | 6 467 000 | 224 700 | 2% |
NS GRUPPA | 6 207 600 | 215 700 | 2% |
SK PRIRODA | 5 673 500 | 197 000 | 2% |
LIDER | 5 658 700 | 196 600 | 2% |
KAPITAL STRAKHOVANIE | 5 449 500 | 189 300 | 2% |
SK TRANSGARANT | 4 956 500 | 172 200 | 1% |
НАСТА | 4 409 500 | 153 200 | 1% |
STANDART-REZERV | 4 107 600 | 142 700 | 1% |
UGORIA | 3 809 300 | 132 300 | 1% |
RENESSANCE STRAKHOVANIE | 3 602 800 | 125 200 | 1% |
Total of the 20 companies | 198 830 000 | 6 908 000 | 57% |
Grand total | 350 000 000 | 12 160 000 | 100% |
Remark: The top twenty insurers, representing only 1.86% of the total companies' number, control 57% of the market.
Premiums split by class of business: 2004-2005
in billions USD| 2004 | % | 2005 | % | |
|---|---|---|---|---|
| Voluntary insurance | ||||
Life insurance | 3.68 | 21.6% | 0.88 | 5.2% |
Personal lines insurance | 1.90 | 11.2% | 2.22 | 13.0% |
Property insurance | 5.52 | 32.5% | 6.45 | 37.8% |
Liability insurance | 0.44 | 2.6% | 0.56 | 3.3% |
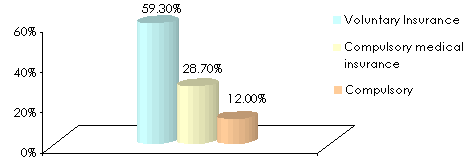
Voluntary insurance total | 11.54 | 67.9% | 10.11 | 59.3% |
| Compulsory insurance (other than medical) | ||||
Misc.: military insurance, tourists, ... | 0.18 | 1.0% | 0.18 | 1.0% |
Motor TPL insurance | 1.77 | 10.5% | 1.87 | 11.0% |
Total | 1.95 | 11.5% | 2.05 | 12.0% |
Voluntary + Compulsory insurance (other than medical) | 13.49 | 79.4% | 12.16 | 71.3% |
| Compulsory medical insurance | ||||
Compulsory medical insurance total | 3.50 | 20.6% | 4.89 | 28.7% |
Grand total | 16.99 | 100.0% | 17.05 | 100.0% |
Premiums split by class of business in 2005

Life turnover projection: 2005-2010
in millions USD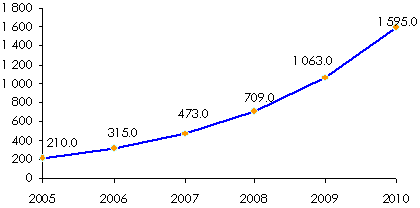
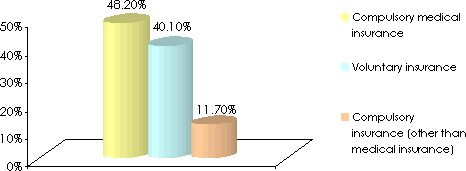
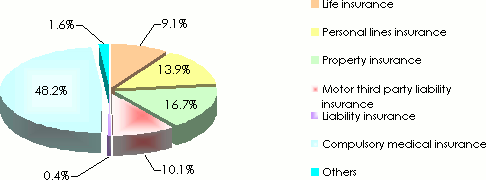
Paid losses split by class of business: 2004-2005
in billions USD| 2004 | % | 2005 | % | |
|---|---|---|---|---|
| Voluntary insurance | ||||
Life insurance | 4.46 | 40.3% | 0.87 | 9.1% |
Personal lines insurance | 1.20 | 10.8% | 1.33 | 13.9% |
Property insurance | 1.18 | 10.6% | 1.59 | 16.7% |
Liability insurance | 0.04 | 0.4% | 0.04 | 0.4% |
Voluntary insurance total | 6.88 | 62.1% | 3.83 | 40.1% |
| Compulsory insurance (other than medical) | ||||
Misc.: military insurance, tourists, ... | 0.14 | 1.3% | 0.15 | 1.6% |
Motor TPL insurance | 0.69 | 6.2% | 0.96 | 10.1% |
Compulsory insurance total (without compulsory medical) | 0.83 | 7.5% | 1.11 | 11.7% |
Total (without compulsory medical) | 7.71 | 69.6% | 4.94 | 51.8% |
| Compulsory medical insurance | ||||
Compulsory medical insurance total | 3.37 | 30.4% | 4.60 | 48.2% |
Grand total | 11.08 | 100.0% | 9.54 | 100.0% |
Paid losses split by class of business in 2005
Exchange rate USD/RUB as at 31/12 | 2000 | 2001 | 2002 | 2003 | 2004 | 2005 |
28.160 | 30.137 | 31.784 | 29.454 | 27.748 | 28.782 |
Thanks: We thank Moscow Re for their kind assistance in the conception of this chapter.
Sources:
- Moscow Re : Russia's Insurance Market 2004
- Federal Insurance Supervisory Service
- Insurance News Agency
- AMSKOM (Agency for Mass Insurance Communications)