The 2001-2010 decade is:
- 7 563 events
- 1.2 million victims
- 1 023 billion USD of damages
- 327 billion USD of claims paid by insurers
Number and types of catastrophes
 Devastating tsunamis, major hurricanes and typhoons, intense floods, destructive earthquakes, extreme heat waves and wildfires, etc are among the events that have marked the past decade, at an average rate of 756 hazards per year. Since the peak of 905 claims, reached in 2007, the trend has been decreasing. The past five years, however, accounted for almost 60% of the decade’s claims.
A typological analysis of these catastrophes shows that floods account for 1 822 events, that is, nearly a quarter of the total claims. Forest fires come second with 893 claims (that is, 12% of overall losses), followed by storms (819 events, that is, nearly 11% of all claims).
Nearly 66.5% of catastrophes are of atmospheric origin, 16.2% of geological origin and 17.3% of mixed origins (fires, avalanches, ...).
Geographical distribution of catastrophes
In terms of frequency, it is the Asian continent that records the largest number of catastrophes, that is, 2 250 events, followed by the American continent with 2 118 events and Europe with 2 005 hazards.
An extremely deadly decade
The past decade has been extremely deadly with an average of 124 423 victims per year. An inter-annual comparison shows that most casualties were sustained in 2010 with 391 017 deaths. This catastrophic toll is due to the earthquake of Haiti and the heat wave in Russia. With 11 852 deaths, the year 2009 was the least deadly since it has not experienced major catastrophes.
Number of events and victims per continent between 2001 and 2010| Nomber of events | Share in % | Number of victims | Share in % | |
|---|---|---|---|---|
Asia | 2 250 | 29.8 | 793 312 | 63.7 |
Americas | 2 118 | 28 | 343 907 | 27.6 |
Europe | 2 005 | 26.5 | 92 379 | 7.5 |
Oceania | 438 | 5.8 | 1 130 | 0.1 |
Africa | 752 | 9.9 | 13 502 | 1.1 |
Total | 7 563 | 100 | 1 244 230 | 100 |
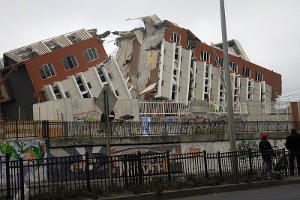 Chile earthquake, 2010 © Claudio Núñez [4], CC BY-SA 2.0 [5] Chile earthquake, 2010 © Claudio Núñez [4], CC BY-SA 2.0 [5] |
So few during the decade, yet so deadly are the earthquakes which claimed the lives of 576 474 people that is, 46% of the total victims. Tsunamis come second with 271 775 deaths (22% of the total toll), followed by hurricanes and tropical storms that have resulted in the death of 229 037 people (18.4%). Heat waves with 92 674 victims are at the origin of 7.5% of deaths while floods has caused 55 049 deaths (4.5% of the total toll).
In the developed countries, natural catastrophes are less deadly. Indeed, it is in Europe, that the study finds the least number of victims, that is, 7.5% of the total toll, while Asia, alone, accounts for nearly 65% of deaths.
Economic cost of natural catastrophes
In financial terms, the past decade has been the most expensive in 30 years. It caused 1023 billion USD of economic losses, 327 billion of which (that is 32%), were supported by insurers and reinsurers.
A ranking based on the economic costs of natural catastrophes has shown that hurricanes and storms are by far the most expensive events. The bill for these catastrophes accounts for more than 43% of the total cost of damages, followed by floods with 23% of losses and earthquakes with 13.5%.
The high cost of hurricanes and storms is due to the recurring nature of these events. Nearly 91 of these events occur each year worldwide, 53 of which reached the cyclonic stage.
It is also worth noting that between 2001 and 2010, the costliest natural catastrophes are Hurricane Katrina, which occurred in 2005 in the United States (125 billion USD), followed by the tsunami in Indonesia 2004 (50 billion USD) and floods in Pakistan 2010 (43 billion USD).
Finally, with climate change in the picture, the natural catastrophes are poised to increase with considerable impact on global finance. According to the "Climate change scenarios-Implications for Strategic Asset Allocation," report, published by the consulting firm Mercer, the overall cost of damages to infrastructure, crops and drinking water sources could exceed 4000 billion USD by 2030.
This is an alarming figure that defies any forecasts.
Number of events, victims and annual cost of the world natural catastrophes between 2001 and 2010
in billions USD| Number of events | Number of victims | Total cost | Insured cost | |
|---|---|---|---|---|
2001 | 640 | 36 224 | 36 | 11 |
2002 | 530 | 12 157 | 55 | 13 |
2003 | 632 | 70 632 | 65 | 16 |
2004 | 608 | 295 262 | 145 | 44 |
2005 | 867 | 105 403 | 210 | 94 |
2006 | 853 | 78 560 | 50 | 15 |
2007 | 906 | 17 823 | 82 | 30 |
2008 | 891 | 225 302 | 200 | 45 |
2009 | 844 | 11 850 | 50 | 22 |
2010 | 792 | 391 017* | 130 | 37 |
Total | 7 563 | 1 244 230 | 1023 | 327 |