 In a country characterized by volatile results because of its exposure to large-scale fire losses, Gulf Insurance has managed to diversify its production and reduce its exposure to major risks, and at the same time, its dependence on reinsurance. The 2010 portfolio is made up of 60% of personal line insurance and motor risks.
The diversification of local portfolio has been coupled with a substantial development of the company abroad.
It is in fact, in 1996, upon the entry of the shareholder Kipco into its capital, that Gulf Insurance started its shift. In 2000, the company made its first acquisition abroad by taking control of 90% of the insurer Saudi Pearl. Ever since, Gulf Insurance has been present not only in Saudi Arabia but also in Bahrain, Egypt, Lebanon, Jordan and Syria.
The company’s success on the local and international markets is owed to the strategic choices made by its leaders who, very soon, managed to invest in new technologies. Gulf Insurance is one of the first insurance companies in the Middle East to have introduced the online sale of its products. Moreover, all of its subsidiaries abroad are connected to a computer platform developed at the head office, another defining element of its success story.
 |  |
| Khaled Al Hassan | Farqad Al Sane |
| Managing director and CEO | Chairman of the borad of directors |
Gulf Insurance in 2010
| Share capital | 60 445 000 USD |
| Turnover | 426 744 723 USD |
| Shareholder's equity | 294 219 191 USD |
| Total assets | 927 660 558 USD |
| Technical result | 30 412 098 USD |
| Profit | 33 911 162 USD |
| Net loss ratio | 69.9% |
| Expenses ratio | 17% |
| Net combined ratio | 86.9% |
| Number of subsidiaries and associate companies | 8 |
| Number of direct underwriting offices | 18 |
Management
| Chairman of the board of directors | Farqad Al Sane |
| Manging director and CEO | Khalid Al Hassan |
| General manager | Tareq Abdulwahab Al Sahhaf |
| Deputy general manager | Adnan Al Baghli |
| Deputy general manager | Rafat Al Salamouny |
| Deputy general manager | Anwar Al Rufidi |
| Chief financial officer | Hatem Selim |
| IT manager | Thamer Ibrahim Arab |
Main shareholders
| Fairfax Middle East Co. Ltd | 41.43% |
| Kuwait Projects Holding Co. | 38.77% |
| Kuwait United Consultancy | 5.27% |
| Other shareholders | 14.53% |
Main technical highlights: 2006-2010
in USD| 2006 | 2007 | 2008 | 2009 | 2010 | |
|---|---|---|---|---|---|
Gross written premiums | 245 289 794 | 270 332 516 | 317 018 038 | 339 937 830 | 426 744 723 |
Written premiums net of reinsurance | 129 644 623 | 141 214 325 | 155 191 313 | 182 734 901 | 211 899 736 |
Net earned premiums | 126 628 174 | 138 305 374 | 151 892 661 | 172 546 683 | 196 310 941 |
Net incurred losses | 68 114 957 | 90 919 317 | 87 788 943 | 125 590 645 | 137 283 450 |
Net loss ratio | 53.8% | 65.7% | 57.8% | 72.8% | 69.9% |
Management expenses | 40 053 903 | 58 567 286 | 61 378 760 | 67 220 823 | 72 591 722 |
- Commissions | 15 742 155 | 22 431 171 | 22 923 500 | 24 788 900 | 28 439 032 |
- Overhead expenses | 24 311 748 | 36 136 115 | 38 455 260 | 42 431 923 | 44 152 690 |
Expenses ratio | 16.3% | 21.7% | 19.4% | 19.8% | 17% |
Technical ratio | 13 674 755 | 16 279 566 | 29 451 308 | 18 029 484 | 30 412 098 |
Financial income | 22 160 985 | 142 759 485 | - 3 835 697 | 13 188 113 | 14 368 616 |
Profit | 30 144 649 | 142 500 766 | 17 932 680 | 21 233 408 | 33 911 162 |
Evolution of premiums, losses and results
in thousands USD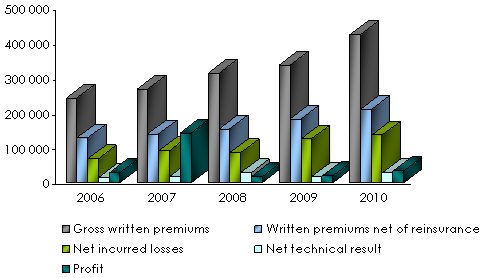
Evolution of net written premiums per class of business: 2006-2010
in USD| 2006 | 2007 | 2008 | 2009 | 2010 | Shares 2010 | |
|---|---|---|---|---|---|---|
| Non life | ||||||
Marine and aviation | 4 010 844 | 6 076 239 | 7 243 041 | 5 938 250 | 5 612 241 | 2.6% |
Property damage | 5 847 011 | 2 984 201 | 3 605 492 | 3 706 235 | 7 128 779 | 3.4% |
Motor and casualty | 49 659 767 | 81 673 301 | 92 401 964 | 107 871 154 | 107 160 962 | 50.6% |
Engineering | - | - | - | 1 512 107 | 4 076 438 | 1.9% |
Total non life | 59 517 622 | 90 733 741 | 103 250 497 | 119 027 747 | 123 978 420 | 58.5% |
| Life | ||||||
Health and life | 70 127 001 | 50 480 584 | 51 940 816 | 63 707 154 | 87 921 316 | 41.5% |
Grand total | 129 644 623 | 141 214 325 | 155 191 313 | 182 734 901 | 211 899 736 | 100% |
Evolution of net incurred losses per class of business: 2006-2010
in USD| 2006 | 2007 | 2008 | 2009 | 2010 | Shares 2010 | |
|---|---|---|---|---|---|---|
| Non life | ||||||
Marine and aviation | 868 547 | 750 590 | 1 204 977 | 363 964 | 628 699 | 0.5% |
Property damage | 4 021 532 | 779 573 | 1 418 806 | 1 111 554 | 4 738 596 | 3.4% |
Motor and casualty | 29 058 707 | 44 312 789 | 50 663 320 | 75 225 386 | 65 469 983 | 47.7% |
Engineering | - | - | - | 1 635 350 | 1 661 886 | 1.2% |
Total non life | 33 948 786 | 45 842 952 | 53 287 103 | 78 336 254 | 72 499 164 | 52.8% |
| Life | ||||||
Health and life | 34 166 171 | 45 076 365 | 34 501 840 | 47 254 391 | 64 784 286 | 47.2% |
Grand total | 68 114 957 | 90 919 317 | 87 788 943 | 125 590 645 | 137 283 450 | 100% |
Evolution of life and non life premiums and losses: 2006-2010
in thousands USDEvolution of net written premiums 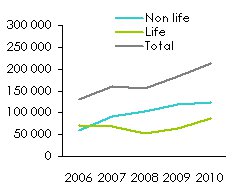 | Evolution of net incurred losses 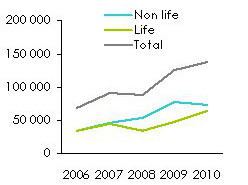 |

Evolution of net technical results per class of business: 2006-2010
in USD| 2006 | 2007 | 2008 | 2009 | 2010 | Shares 2010 | |
|---|---|---|---|---|---|---|
| Non life | ||||||
Marine and aviation | 1 863 676 | 3 303 183 | 4 378 878 | 5 810 850 | 5 268 282 | 17.3% |
Property damage | 1 055 377 | 597 103 | 1 674 172 | 2 163 327 | 1 030 608 | 3.4% |
Motor and casualty | 4 907 325 | 7 316 736 | 13 742 133 | 549 404 | 11 811 658 | 38.9% |
Engineering | - | - | - | 1 944 724 | 1 981 942 | 6.5% |
Total non life | 7 826 378 | 11 217 022 | 19 795 183 | 10 468 305 | 20 092 490 | 66.1% |
| Life | ||||||
Health and life | 5 848 377 | 5 062 544 | 9 656 125 | 7 561 179 | 10 319 608 | 33.9% |
Grand total | 13 674 755 | 16 279 566 | 29 451 308 | 18 029 484 | 30 412 098 | 100% |
Evolution of net loss ratio per class of business: 2006-2010
| 2006 | 2007 | 2008 | 2009 | 2010 | ||
|---|---|---|---|---|---|---|
| Non life | ||||||
Marine and aviation | 22.3% | 12.9% | 17.5% | 6% | 11.3% | |
Property damage | 63.3% | 35.8% | 41.4% | 31.6% | 88.2% | |
Motor and casualty | 61% | 59.9% | 57.8% | 72.3% | 63% | |
Engineering | - | - | - | 68.5% | 60% | |
Total non life | 58.6% | 55.9% | 54.4% | 67.5% | 61.6% | |
| Life | ||||||
Health and life | 49.7% | 80.1% | 64% | 83.6% | 82.4% | |
Grand total | 53.8% | 65.7% | 57.8% | 72.8% | 69.9% | |
Evolution of net ratios: 2006-2010

Exchange rate KWD/USD as at 31/12 | 2006 | 2007 | 2008 | 2009 | 2010 |
3.47693 | 3.64897 | 3.66032 | 3.49663 | 3.56290 |

Contact
| Head office | Ahmed Al Jaber Street, Sharq P.O Box 1040, Safat 13011, Kuwait |
| Phone | (+965) 1802080 / 22961999 |
| Fax | (+965) 22961998 |
contacts [at] gulfins [dot] com [dot] kw | |
| Website |