The structure of the insurance markets in the Maghreb
Algeria
 Algiers' coastline © Damien Boilley [4], CC BY 2.0 [5] Algiers' coastline © Damien Boilley [4], CC BY 2.0 [5] |
With 1.148 billion USD in turnover in 2011, Algeria is holding the 64th ranking in terms of written premiums, underwriting 7.6% of the overall contributions of the African continent (excluding South Africa).
The 0.7% insurance penetration rate is low compared to that of industrialized countries (9%) and to the average rate of emerging countries (3%). With one agency or insurance office for 28 000 inhabitants (versus 1 for 5000 worldwide) expenditure incurred for coverage purchase remains poor. In 2011, insurance density was only 34 USD per capita, far beyond the world average of 620 USD.
Despite the end of state monopoly on insurance operations, public actors largely dominate the market where they control nearly 75% of the turnover.
In 2011, 19 insurers were sharing the market. Foreign companies show a growing interest in Algeria. Axa, the Macif and BNP Paribas have benefited from recent participations in local companies.
Market turnover: 2008-2011 (excluding CCR)
in thousands USD| 2008 | 2009 | 2010 | 2011 | Shares 2011 | |
|---|---|---|---|---|---|
SAA | 241 854 | 265 027 | 275 187 | 280 198 | 24.40% |
CAAT | 187 021 | 189 366 | 193 078 | 193 940 | 16.89% |
CAAR | 163 142 | 188 159 | 175 515 | 182 055 | 15.85% |
CASH | 149 935 | 126 263 | 102 564 | 104 675 | 9.12% |
CNMA | 58 356 | 70 595 | 92 515 | 89 199 | 7.77% |
CIAR | 68 217 | 86 204 | 81 986 | 80 997 | 7.05% |
Alliance Assurances | 31 264 | 40 470 | 46 929 | 51 715 | 4.50% |
2A | 28 242 | 37 206 | 41 665 | 42 440 | 3.70% |
Salama Assurances | 24 704 | 35 333 | 34 823 | 37 060 | 3.23% |
GAM | 24 247 | 29 913 | 39 910 | 37 749 | 3.27% |
TRUST | 19 752 | 20 732 | 25 487 | 24 751 | 2.15% |
CARDIF* | 3 346 | 7 606 | 9 803 | 11 938 | 1.04% |
TALA* | - | - | - | 7 433 | 0.65% |
SAPS* | - | - | - | 3 193 | 0.28% |
MAATEC | 531 | 568 | 823 | 1 073 | 0.09% |
AXA Dommages | - | - | - | 27 | 0.01% |
MACIR Vie* | - | - | - | - | - |
CAARAMA* | - | - | - | - | - |
AXA Vie* | - | - | - | - | - |
Total | 1 000 611 | 1 097 440 | 1 120 285 | 1 148 444 | 100% |
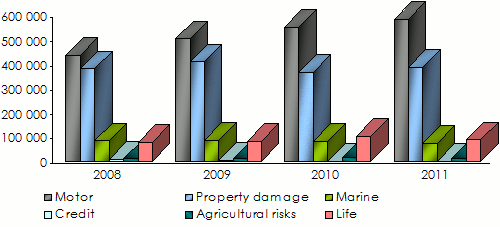
Turnover’s evolution per class of business: 2008-2011
Motor insurance accounts for nearly 51% of total market premiums. It represents 60% of the portfolio of private companies. Life insurance does not exceed 8% of the overall written premiums.
in thousands USD| 2008 | 2009 | 2010 | 2011 | Shares 2011 | |
|---|---|---|---|---|---|
| Non life | |||||
Motor | 435 272 | 502 794 | 552 911 | 582 444 | 50.72% |
Property damage | 382 444 | 409 637 | 366 167 | 387 099 | 33.70% |
Marine | 84 784 | 86 687 | 82 877 | 75 247 | 6.55% |
Credit | 8 048 | 5 364 | 644 | 186 | 0.01% |
Agricultural risks | 10 554 | 10 813 | 14 409 | 13 886 | 1.21% |
Total non life | 921 103 | 1 015 295 | 1 017 008 | 1 058 861 | 92.19% |
| Life | |||||
Total life | 79 508 | 82 145 | 103 277 | 89 583 | 7.81% |
Grand total | 1 000 611 | 1 097 440 | 1 120 285 | 1 148 444 | 100% |
 Sources: Annual reports, General management of the treasury, Insurance department, Ministry of Finance, Algeria
 Morocco
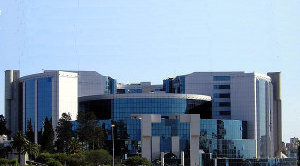
 Business Center, Rabat, Morocco © Davide Cesare Veniani [6], CC BY-SA 3.0 [7] Business Center, Rabat, Morocco © Davide Cesare Veniani [6], CC BY-SA 3.0 [7] |
With a turnover of 2.788 billion USD in 2011, Morocco holds the 53rd position in the world ranking designed by Sigma magazine. First Maghreb country and second African country, Morocco accounts for 18.2% of the continent’s total revenues, excluding South Africa.
The 2% penetration rate is higher than that Tunisia and Algeria, but still down compared to the rate posted by some African countries like South Africa (15.9%), Namibia (8%), and Kenya (3.2%). Insurance density is only 89 USD per capita.
In 2011, 17 insurers including three mutuals shared the market. The state is now present in direct insurance through the national reinsurer SCR which has a 40% stake in the group Atlanta Sanad and also a participation in the credit insurer Smaex.
Turnover’s evolution per company*: 2008-2011
in thousands USD| 2008 | 2009 | 2010 | 2011 | Shares 2011 | |
|---|---|---|---|---|---|
Wafa Assurance | 522 228 | 548 833 | 539 056 | 616 287 | 22.10% |
RMA Watanya | 503 118 | 537 124 | 533 063 | 511 067 | 18.32% |
Axa Assurance Maroc | 360 359 | 390 912 | 357 635 | 382 133 | 13.70% |
CNIA Essaada Assurance | 341 380 | 361 397 | 356 342 | 354 597 | 12.72% |
Sanad | 141 672 | 152 414 | 145 942 | 150 979 | 5.42% |
Atlanta | 131 830 | 144 523 | 142 501 | 141 350 | 5.07% |
MCMA | 75 910 | 96 192 | 89 592 | 136 078 | 4.88% |
Zurich | 93 114 | 104 810 | 109 450 | 122 568 | 4.40% |
Marocaine Vie | 98 477 | 108 936 | 110 112 | 117 959 | 4.23% |
CAT | 78 996 | 80 200 | 79 368 | 77 291 | 2.77% |
MAMDA | 39 241 | 42 007 | 48 625 | 64 773 | 2.32% |
Maroc Assistance | 29 658 | 35 173 | 37 595 | 38 054 | 1.36% |
Isaaf Mondiale Assistance | 29 727 | 36 198 | 35 652 | 36 036 | 1.29% |
MATU | 28 474 | 26 021 | 25 865 | 25 115 | 0.90% |
Euler Hermes ACMAR | 5 914 | 6 198 | 6 637 | 9 603 | 0.34% |
Axa Assistance Maroc | 2 359 | 3 054 | 3 582 | 4 236 | 0.15% |
Wafa IMA Assistance | - | - | - | 766 | 0.03% |
Total | 2 482 459 | 2 673 991 | 2 621 018 | 2 788 893 | 100% |
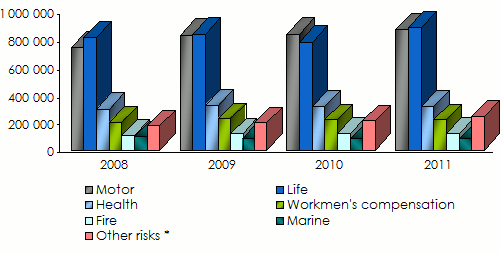
Turnover’s evolution per class of business (excluding SCR): 2008-2011
Unlike the other Maghreb countries, life and capitalization insurance constitutes the most important class of business with 32% of market shares in 2011, compared to 31.5% for motor.
in thousands USD| 2008 | 2009 | 2010 | 2011 | Shares 2011 | |
|---|---|---|---|---|---|
| Non life | |||||
Motor | 753 234 | 841 246 | 847 896 | 879 049 | 31.52% |
Health | 309 495 | 335 042 | 326 748 | 326 767 | 11.72% |
Workmen’s compensation | 208 451 | 233 819 | 226 998 | 228 458 | 8.19% |
Fire | 109 146 | 120 275 | 123 740 | 124 036 | 4.45% |
Marine | 99 006 | 88 325 | 84 632 | 85 210 | 3.06% |
Credit | 67 657 | 81 205 | 83 799 | 89 134 | 3.20% |
Third party liability | 48 586 | 54 182 | 54 908 | 57 249 | 2.05% |
Engineering | 36 777 | 33 784 | 36 480 | 39 621 | 1.42% |
Others | 17 074 | 20 969 | 22 743 | 47 341 | 1.70% |
Total non life | 1 649 425 | 1 808 847 | 1 807 944 | 1 876 864 | 67.30% |
| Life | |||||
Total life | 824 451 | 848 351 | 789 786 | 892 980 | 32.02% |
Total life and non life | 2 473 877 | 2 657 198 | 2 597 730 | 2 769 845 | 99.32% |
| Acceptances | |||||
Total acceptances | 8 583 | 16 793 | 23 288 | 19 048 | 0.68% |
Grand total | 2 482 459 | 2 673 991 | 2 621 018 | 2 788 893 | 100% |
 *Including credit, third party liability, engineering and acceptances Source: Moroccan federation of insurance and reinsurance companies (FMSAR)
 Tunisia
With 788 million USD of premium income, Tunisia ranks 77th worldwide according to Sigma. It accounts for 5.2% of the overall premiums written in Africa (excluding South Africa).
The 1.8% penetration rate is more than 2.5 times as high as that of Algeria. Insurance density, 77 USD per capita, has steadily increased in recent years but is still lagging behind international standards.
The market includes 19 direct insurance companies 15 of which are non-life and 4 life companies.
Turnover’s evolution per company (excluding Tunis Re): 2008-2011
in thousands USD| 2008 | 2009 | 2010 | 2011 | Shares 2011 | |
|---|---|---|---|---|---|
Star | 157 746 | 159 954 | 149 130 | 137 628 | 17.45% |
Comar | 90 404 | 91 294 | 90 868 | 92 623 | 11.75% |
GAT | 55 695 | 59 576 | 66 834 | 71 577 | 9.08% |
Astree | 61 630 | 63 881 | 63 645 | 67 716 | 8.59% |
Maghrebia | 74 071 | 61 365 | 60 357 | 63 122 | 8.00% |
AMI | 64 599 | 70 029 | 64 896 | 61 720 | 7.83% |
Carte | 61 242 | 59 987 | 62 338 | 50 062 | 6.35% |
MAE | 42 813 | 45 815 | 47 152 | 46 167 | 5.85% |
Assurances Biat | 38 480 | 38 644 | 42 223 | 42 475 | 5.38% |
Lloyd | 31 952 | 32 525 | 34 160 | 35 056 | 4.44% |
Salim | 21 623 | 25 350 | 25 775 | 27 115 | 3.44% |
MGA | 14 199 | 18 434 | 21 022 | 20 316 | 2.58% |
Maghrebia vie | - | 16 627 | 18 685 | 19 859 | 2.52% |
Hayett | 10 823 | 12 974 | 14 452 | 15 553 | 1.97% |
Carte Vie | - | - | - | 15 450 | 1.96% |
Ctama | 18 690 | 18 310 | 15 592 | 14 559 | 1.85% |
Cotunace | 4 975 | 4 713 | 4 461 | 3 647 | 0.46% |
Amina | 4 019 | 2 101 | 1 955 | 2 155 | 0.27% |
Assurcrédit | 1 300 | 1 521 | 1 713 | 1 841 | 0.23% |
Total | 754 261 | 783 100 | 785 258 | 788 641 | 100% |
Turnover’s evolution per class of business 2008-2010
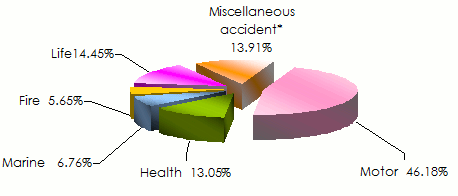
As in Algeria, motor insurance remains dominant. It accounts for 46% of the premium income in 2010, followed by life and health classes.
in USD| 2008 | 2009 | 2010 | Shares 2010 | |
|---|---|---|---|---|
| Non life | ||||
Motor | 341 735 222 | 362 723 926 | 362 607 185 | 46.18% |
Health group | 104 700 493 | 110 265 469 | 102 511 681 | 13.05% |
Workmen’s compensation | -36 570 | -34 786 | -269 377 | -0.03% |
Marine | 55 977 925 | 49 647 700 | 53 097 303 | 6.76% |
Fire | 46 627 008 | 47 325 834 | 44 339 480 | 5.65% |
Credit | 7 312 349 | 7 260 222 | 7 085 336 | 0.90% |
Livestock | 6 218 940 | 7 017 209 | 6 522 125 | 0.83% |
Miscellaneous accident | 100 286 368 | 88 770 700 | 88 072 419 | 11.22% |
Total non life | 662 821 735 | 672 976 275 | 663 966 151 | 84.56% |
| Life | ||||
Total life | 86 507 477 | 102 708 107 | 113 487 621 | 14.45% |
Total life and non life | 749 329 212 | 775 684 382 | 777 453 772 | 99.01% |
Acceptances | 4 931 936 | 7 416 420 | 7 804 676 | 0.99% |
Grand total | 754 261 148 | 783 100 801 | 785 258 448 | 100% |
Turnover’s breakdown per class of business in 2010
 * Including credit, livestock and acceptances Source: Tunisian federation of insurance and reinsurance companies (FTUSA)
 Operational performances of Maghreb companies
Algeria
 Ministry of Finance © Stayfi [8], CC BY-SA 3.0 (modified) [7] Ministry of Finance © Stayfi [8], CC BY-SA 3.0 (modified) [7] |
The performance of Algerian companies is solid but may be affected by corporate competition. Combined ratios remain good even if some deterioration was felt in recent years.
The market is currently at a crossroads, facing several challenges that must be overcome, otherwise recession may be back. Despite an enormous economic potential, the volume of premiums does not take off. The market is still dominated by the motor class whose average premium per vehicle is the lowest in the Maghreb region. For example, the third party liability premium of an average car engine is 12 times as high in Morocco and 7 times as high in Tunisia.
The fire and property damage insurance has been stagnating. Between 2008 and 2011, it grew by just 1.3% despite the presence of large oil risks and the execution of major public projects in recent years.
The situation is worse in marine insurance, whose premiums has gone down by 11% during the 2008-2011 period. Finally, life insurance is far behind compared to the property damage class. In this area, the gap with the other Maghreb countries is important. In Algeria, life insurance accounts for 7.8% of the overall premiums written in 2011 while in Tunisia and Morocco it is respectively set at 12% and 32%.
Main technical highlights: 2007-2011
in millions USD| 2007 | 2008 | 2009 | 2010 | 2011 | |
|---|---|---|---|---|---|
Gross written premiums | 837 | 1 001 | 1 097 | 1 120 | 1 148 |
Technical result* | 102 | 122 | 101 | 126 | 55 |
Financial income | 34 | 30 | 32 | 34 | 36 |
Net technical result | 136 | 152 | 133 | 160 | 91 |
Net profit | 19 | 56 | 73 | 107 | 72 |
Net profit in % of the gross written premiums | 2.28% | 5.69% | 6.69% | 9.54% | 6.26% |
Tunisia
 Habib Bourguiba avenue, Tunis [9], CC0 1.0 [10] Habib Bourguiba avenue, Tunis [9], CC0 1.0 [10] |
Since 2007, the market has been showing signs of weakness, with premium growth losing momentum and turning insignificant in 2011. The non-life class of business is at a standstill between 2008 and 2010, reporting just 0.17% in premium growth. It is the life sector which drives the market, moving from 86 507 477 TND (67 832 242 USD) to 113 487 621 TND (75 918 679 USD), a growth rate of 31%. As in Algeria, the marine, fire and miscellaneous accident premiums have dwindled down over the years.
After having soared in 2008, underwriting results are in sharp decline in 2009 (-30%) and turning negative in 2010. As to the year 2011, it was impacted by political events in Tunisia.
For some time now, the market has been strained by deteriorating results in motor insurance. Given the narrowness of the other classes of business, it is the motor sector that makes the "result". The deteriorating performance of the motor business, combined with stagnant non-life premiums weakened the market. In addition, in recent years, some major industrial accidents have increased the combined ratio: 89.9% in 2010 and probably more in 2011.
Main technical highlights: 2007-2011
in thousands USD| 2007 | 2008 | 2009 | 2010 | 2011 | |
|---|---|---|---|---|---|
Gross written premiums | 726 084 | 754 261 | 783 108 | 785 258 | 788 641 |
Technical result * | 8 392 | 43 191 | 29 471 | -5 196 | - |
Financial income | 57 224 | 60 361 | 66 318 | 76 467 | - |
Net technical result | 65 616 | 103 552 | 95 789 | 71 271 | - |
Net profit | 56 408 | 91 807 | 98 780 | 75 505 | 31 710 |
Net profit in % of the gross written premiums | 7.76% | 12.17% | 12.61% | 9.61% | - |
Net combined ratio | 88.10% | 82.50% | 96.00% | 89.90% | - |
Morocco
In recent decades, the Moroccan market has gone through a major restructuring process. Relying on license withdrawals and mergers, the authorities have reshaped the market, encouraging the emergence of large groups. From 2007 to 2011, the written premiums expressed in dirham, went up by 35%. The development of bancassurance has prompted life underwriting. It is in health insurance that Morocco found growth opportunities.
Main technical highlights: 2007-2011
in thousands USD| 2007 | 2008 | 2009 | 2010 | 2011 | |
|---|---|---|---|---|---|
Gross written premiums | 2 312 980 | 2 482 459 | 2 673 990 | 2 621 018 | 2 788 893 |
Technical result * | -97 555 | -44 372 | 2 858 | 35 120 | -106 815 |
Financial income | 1 357 664 | 544 435 | 500 014 | 680 820 | 677 516 |
Net technical result | 1 260 109 | 500 064 | 502 872 | 715 940 | 570 701 |
Net profit | 1 071 943 | 412 279 | 393 285 | 457 046 | 429 796 |
Net profit in % of the gross written premiums | 46.34% | 16.06% | 14.70% | 17.43% | 15.41% |
Net combined ratio | 99.40% | 98.70% | 94.79% | 95.14% | 91.10% |
As for premiums, underwriting results have also followed a positive trend. The combined ratio has been declining since 2007, when it peaked at 99.4% to finish at 91.1% in 2011. The market is dominated by two large companies, backed by banks: Wafa and RMA Watanya.
Development potential versus constraints in the Maghreb
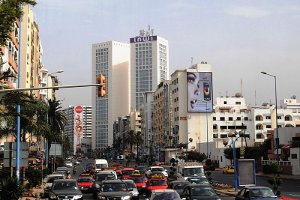 Twin Center,Casablanca, Morocco © HombreDHojalata [11], CC BY-SA 3.0 [7] Twin Center,Casablanca, Morocco © HombreDHojalata [11], CC BY-SA 3.0 [7] |
While large differences exist between the markets of Algeria, Tunisia and Morocco in terms of premiums, significant potential for development exists. In a study conducted in May 2012, Standard & Poor’s has taken an optimistic position, maintaining its long-term growth outlooks in life, health and personal lines of business.
The current tightness of personal line and corporate markets suggests a significant premium growth once current problems have been surmounted. This increase is, however, subject to several conditions:
- the modernization of financial markets,
- the creation of new insurance products including takaful insurance,
- the expansion of distribution networks including bancassurance, internet and mobile phone. Direct sales prevails in Algeria while bancassurance is at its first steps. This business is more advanced in Morocco and Tunisia, where banks have a better image. The brokers and general agents craft is poised to grow in Morocco where they are concentrated in large cities. There are 40 insurance intermediaries for 1 million inhabitants in Morocco. They are proportionately twice as many in Tunisia,
- the development of tax incentives to promote long-term savings products just like the initiative taken in Morocco in 2011,
- the extension of compulsory insurance covers,
- tighter controls and the implementation of stricter financial and technical rules.
While growth prospects linger on, some obstacles to the development of insurance are looming ahead. Tunisia, which was severely strained by the Arab Spring, sustained the heavy blow of the economic crisis. Political instability is not favourable to the short-term development of business. Other threats are also noticeable:
- the economic slowdown in Europe and its implications for business in North Africa (56% of exports are going to Europe),
- an ever-growing competition,
- the slowdown in government investments in construction and major projects due to the economic crisis. These investments are the source of growth, particularly in Algeria,
- underdeveloped (almost nonexistent in Algeria) and volatile financial markets,
- in Tunisia, the high household indebtedness reduced savings while short-term consumption is likely to trigger a decline in cash or even an aggravation of the economic crisis in case banks lose control.
| Exchange rate as at 31/12 Algeria DZD/USD Morocco MAD/USD Tunisia TND/USD | 2008 0.01474 0.12572 0.78412 | 2009 0.01371 0.1277 0.76309 | 2010 0.01371 0.11983 0.7009 | 2011 0.01325 0.11672 0.66896 |