India
 View of Mumbai, India © Cididity Hat [4], CC BY-SA 3.0 [5]
The first steps of the Indian insurance date back to the late 19th century, with first insurance company, Commercial Union Assurance, being established in 1862. After the withdrawal of the British, the industry was nationalized. In 1956, life insurance came under the control of the state with the creation of Life Insurance Corporation of India, which became the country’s sole life business. In 1974, it was the non-life insurance class that was nationalized with four companies sharing the market: New India, Oriental, United India and National. These new companies are headed by a holding company, General Insurance Corporation of India (GIC), which also acts as a reinsurer and regulator of the non-life market.
It is after privatization of the insurance industry in 1994 that the market begins to expand rapidly. In August 2012, non-life insurance sector has six national companies1 and twenty-one privately owned ones, three of which specializing in health. Life insurance accounts for twenty four companies with only one endowed with state capital. GIC becomes the national reinsurer, receiving a legal cession of 10%.
Penetration and density rates
After reaching a maximum of 4.6% in 2009, life insurance penetration rate has been in sharp decline over the past three years. The study of non-life penetration rate has shown an almost stagnation state during the 2003-2009 period. It was not until 2010 that the rate has reported a significant increase.
In comparison with South Asian countries, insurance penetration rate is of 4.76% in Malaysia, 6% in Singapore and 4.17% in Thailand.
From 2003 to 2012, density, that is , the per capita amount dedicated to insurance, has almost gone threefold for life and non-life classes of business. Despite this growth, density in India (53 USD) is far below that of other BRICS countries: South Africa (1081 USD), Brazil (414 USD), Russia (182 USD) and China (179 USD).
1The four companies established in 1974 along with the export credit insurer "Export Credit Guarantee Corporation" and agricultural insurer "Agriculture Insurance Co of India Ltd"
Evolution of penetration and density rates: 2003-2012
| Life | Non Life | Total | ||||
|---|---|---|---|---|---|---|
| Density in USD | Penetration in % | Density in USD | Penetration in % | Density in USD | Penetration in % | |
| 2003 | 12.9 | 2.26% | 3.5 | 0.62% | 16.4 | 2.88% |
| 2004 | 15.7 | 2.53% | 4 | 0.64% | 19.7 | 3.17% |
| 2005 | 18.3 | 2.53% | 4.4 | 0.61% | 22.7 | 3.14% |
| 2006 | 33.2 | 4.10% | 5.2 | 0.60% | 38.4 | 4.80% |
| 2007 | 40.4 | 4% | 6.2 | 0.60% | 46.6 | 4.70% |
| 2008 | 41.2 | 4% | 6.2 | 0.60% | 47.4 | 4.60% |
| 2009 | 47.7 | 4.60% | 6.7 | 0.60% | 54.3 | 5.20% |
| 2010 | 55.7 | 4.40% | 8.7 | 0.71% | 64.4 | 5.10% |
| 2011 | 49 | 3.40% | 10 | 0.70% | 59 | 4.10% |
| 2012 | 43 | 3.20% | 11 | 0.80% | 53 | 4% |
Source: Insurance Regulatory and Development Authority, India
Licensed insurers as at September 30, 2012
| Public sector | Private sector | Total | |
|---|---|---|---|
Life insurance | 1 | 23 | 24 |
Non life insurance | 6 | 21 | 27 |
Reinsurance | 1 | 0 | 1 |
Total | 8 | 44 | 52 |
Source: Insurance Regulatory and Development Authority, India
Distribution network
 Old Delhi street © McKay Savage [6], CC BY 2.0 [7] Old Delhi street © McKay Savage [6], CC BY 2.0 [7] |
In non-life insurance, the distribution of products is based on agents by 37%. Other networks include direct sales (32%) and brokers (18%). Bancassurance is poised to grow rapidly in the coming years due to the rising number of bank counters. Because the general population is poorly equipped with computers and other equipment of modern communication, the contribution of new technologies in the marketing of insurance products remains marginal.
Life market
Life insurance ranks high on the Indian market, being by far the leading industry in India. In 2012, life insurance companies reported a turnover of 55 billion USD, which accounts for 84.45% of total life and non-life premiums.
The top five life insurers, alone, detain 86.29 % of the market, 70.67% of which go to the only state insurer «Life Insurance Corporation» (LIC).
From 2008 to 2012, the life market has grown by nearly 10%, compared to 46% for non-life insurance. The year 2012 sustained a 14% decrease of life premiums, a decline accounted for, among other things, by significant changes in the insurance code.
Breakdown of life turnover per company
in thousands USD
| 2007/2008 | 2008/2009 | 2009/2010 | 2010/2011 | 2011/2012 | Shares | |
|---|---|---|---|---|---|---|
| Public sector | ||||||
Life Insurance Corp. | 37 552 350 | 30 388 049 | 41 346 378 | 44 926 905 | 39 137 342 | 70.67% |
Total public sector | 37 552 350 | 30 388 049 | 41 346 378 | 44 926 905 | 39 137 342 | 70.67% |
| Private sector | ||||||
ICICI Prudential | 3 399 758 | 2 966 822 | 3 672 688 | 3 948 043 | 2 704 763 | 4.88% |
SBI Life | 1 409 470 | 1 393 378 | 2 245 118 | 2 858 320 | 2 533 498 | 4.58% |
HDFC Standard | 1 218 041 | 1 075 098 | 1 556 533 | 1 988 121 | 1 968 043 | 3.55% |
Bajaj Allianz | 2 438 135 | 2 052 657 | 2 537 460 | 2 121 879 | 1 443 625 | 2.61% |
Max Life | 680 550 | 745 223 | 1 080 014 | 1 283 426 | 1 232 733 | 2.23% |
Birla Sunlife | 820 338 | 883 274 | 1 223 358 | 1 253 480 | 1 135 286 | 2.05% |
Reliance | 808 618 | 952 967 | 1 467 609 | 1 450 910 | 1 060 491 | 1.92% |
Tata AIA | 513 020 | 530 817 | 776 318 | 879 937 | 700 285 | 1.27% |
Kotak Mahindra | 423 969 | 452 704 | 637 281 | 656 993 | 566 630 | 1.02% |
Metlife | 290 697 | 385 751 | 563 501 | 553 802 | 516 490 | 0.93% |
Aviva | 474 294 | 385 022 | 528 394 | 517 811 | 466 021 | 0.84% |
Canara HSBC | - | 57 266 | 187 192 | 338 232 | 359 002 | 0.65% |
ING Vysya | 290 529 | 278 648 | 364 997 | 377 336 | 324 068 | 0.59% |
IndiaFirst | - | - | 44 796 | 176 293 | 250 371 | 0.45% |
Star Union Dai-ichi | - | 9 697 | 117 848 | 206 075 | 245 359 | 0.44% |
Future Generali | 624 | 29 482 | 120 324 | 160 336 | 150 381 | 0.27% |
Bharti AXA | 29 685 | 69 633 | 148 814 | 174 878 | 149 335 | 0.27% |
IDBI Federal | 2 983 | 61 625 | 126 903 | 179 069 | 142 109 | 0.26% |
Shriram Life | 89 763 | 84 268 | 135 824 | 181 392 | 124 258 | 0.22% |
Aegon Religare | - | 6 030 | 36 807 | 85 805 | 88 217 | 0.16% |
Sahara | 35 973 | 39 892 | 55 681 | 53 745 | 43 586 | 0.08% |
DLF Pramerica | - | 651 | 8 541 | 20 985 | 32 216 | 0.06% |
Edelweiss Tokio | - | - | - | - | 2 099 | 0.00% |
Total private sector | 12 926 448 | 12 460 905 | 17 636 001 | 19 466 885 | 16 238 868 | 29.33% |
Total life | 50 478 798 | 42 848 955 | 58 982 379 | 64 393 790 | 55 376 210 | 100% |
Source: Insurance Regulatory and Development Authority, India
Non life market
In 2012 the four public companies: New India, United, National and Oriental control 57.79% of the market, with the first private company, ICICI Lombard, underwriting only 9.74% of the overall premiums.
The ten largest companies retain almost all receipts, that is, 87.3%.
Breakdown of non life turnover per company
in thousands USD
| 2007/2008 | 2008/2009 | 2009/2010 | 2010/2011 | 2011/2012 | Parts | |
|---|---|---|---|---|---|---|
| Public companies | ||||||
New India | 1 322 924 | 1 064 306 | 1 342 646 | 1 567 049 | 1 647 920 | 16.15% |
United | 937 508 | 826 465 | 1 164 117 | 1 407 967 | 1 577 785 | 15.47% |
National | 1 004 613 | 826 877 | 1 027 715 | 1 373 535 | 1 502 824 | 14.73% |
Oriental | 954 701 | 765 889 | 1 052 497 | 1 204 978 | 1 166 638 | 11.44% |
Total public companies | 4 219 745 | 3 483 537 | 4 586 975 | 5 553 529 | 5 895 167 | 57.79% |
| Private companies | ||||||
ICICI Lombard | 829 095 | 657 274 | 732 162 | 938 813 | 993 462 | 9.74% |
Bajaj Allianz | 596 646 | 506 047 | 551 574 | 633 687 | 633 989 | 6.21% |
IFFCO Tokio | 282 827 | 265 468 | 323 932 | 393 726 | 381 024 | 3.74% |
HDFC ERGO | 55 304 | 65 535 | 203 402 | 282 604 | 354 831 | 3.48% |
Reliance | 487 967 | 369 955 | 439 878 | 365 519 | 330 351 | 3.24% |
TATA AIG | 196 208 | 159 181 | 189 714 | 259 018 | 316 659 | 3.10% |
Royal Sundaram | 174 089 | 155 209 | 202 893 | 252 593 | 285 451 | 2.80% |
Cholamandalam MS | 130 951 | 132 427 | 174 394 | 213 732 | 259 748 | 2.55% |
Shriram | - | 21 978 | 92 642 | 172 421 | 244 296 | 2.40% |
Future Generali | 2 460 | 36 030 | 83 683 | 132 515 | 177 422 | 1.74% |
Bharti Axa | - | 5 506 | 69 064 | 122 301 | 170 524 | 1.67% |
Universal Sompo | 120 | 5 823 | 42 058 | 66 041 | 78 043 | 0.77% |
SBI General | - | - | - | 9 499 | 48 252 | 0.47% |
L&T | - | - | - | 3 807 | 27 662 | 0.27% |
Raheja QBE | - | - | 293 | 1 082 | 2 853 | 0.03% |
Total private companies | 2 755 667 | 2 380 435 | 3 105 689 | 3 847 358 | 4 304 567 | 42.21% |
Grand total | 6 975 412 | 5 863 972 | 7 692 664 | 9 400 887 | 10 199 734 | 100% |
Source: Insurance Regulatory and Development Authority, India
The Indian market remains closed and hardly open to foreign capital. Foreign participation may not exceed 26% in an insurance company. This limit will soon be raised to 49%.
Nevertheless, the market remains quite competitive, with this competition being behind the drastic increase of loss ratios in non life insurance. Most insurers are struggling to make profits.
Evolution of the main technical highlights of the non life market: 2008-2012
in USD
| 2007/2008 | 2008/2009 | 2009/2010 | 2010/2011 | 2011/2012 | |
|---|---|---|---|---|---|
Gross premiums | 6 975 411 618 | 5 863 971 624 | 7 692 663 990 | 9 400 886 784 | 10 199 734 104 |
Net premiums | 5 269 789 210 | 4 716 292 140 | 6 239 133 802 | 7 713 164 448 | 8 574 597 900 |
Net earned premiums | 4 835 368 729 | 4 413 648 204 | 5 777 244 440 | 6 984 948 384 | 7 597 869 969 |
Net incurred losses | 4 104 239 784 | 3 809 314 740 | 4 939 443 784 | 6 516 700 032 | 6 751 085 265 |
Management expenses* | 1 708 731 088 | 1 633 278 024 | 2 148 527 348 | 2 663 777 568 | 2 547 553 140 |
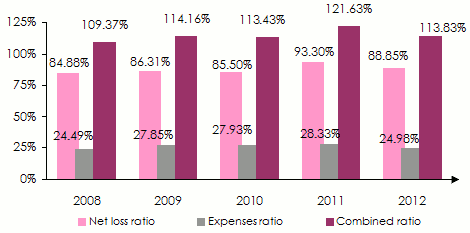
Net loss ratio | 84.88% | 86.31% | 85.50% | 93.30% | 88.85% |
Expenses ratio | 24.49% | 27.85% | 27.93% | 28.33% | 24.98% |
Combined ratio | 109.37% | 114.16% | 113.43% | 121.63% | 113.83% |
Underwriting result | -977 602 143 | -1 028 552 364 | -1 311 133 318 | -2 195 531 424 | -1 700 768 436 |
Net result | 563 902 017 | 76 713 924 | 267 642 122 | -224 981 952 | 6 236 457 |
* Including commissions
Evolution of premiums, losses and results: 2008-2012
in thousands USD 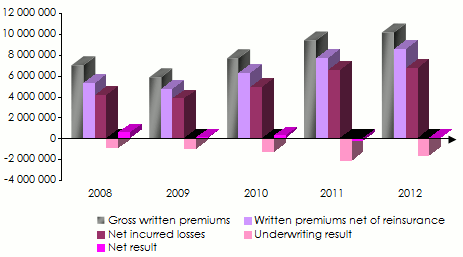 Source: Insurance Regulatory and Development Authority, India
Evolution of ratios: 2008-2012
Breakdown of non life premiums per class of business: 2008-2012
The Indian market, along with the Russian market, is the most diversified in the BRIC group, with motor class accounting for less than 50% of all insurance premiums. The turnover achieved in health insurance comes second with 22.27% of revenues. Miscellaneous risks and fire insurance follow with 16.18% and 10.27% respectively.
in thousands USD
| 2007/2008 | 2008/2009 | 2009/2010 | 2010/2011 | 2011/2012 | 2012 shares | |
|---|---|---|---|---|---|---|
Motor | 3 180 192 | 2 576 519 | 3 343 441 | 4 012 537 | 4 675 634 | 45.84% |
Health | 1 227 031 | 1 176 202 | 1 624 586 | 2 195 620 | 2 271 841 | 22.27% |
Miscellaneous accident | 1 250 003 | 1 079 403 | 1 383 246 | 1 630 818 | 1 650 360 | 16.18% |
Fire | 867 224 | 653 920 | 859 752 | 1 005 770 | 1 047 391 | 10.27% |
Marine | 450 962 | 377 928 | 481 638 | 556 142 | 554 508 | 5.44% |
Total | 6 975 412 | 5 863 972 | 7 692 664 | 9 400 887 | 10 199 734 | 100% |
Source: Insurance Regulatory and Development Authority, India
Life and non life market
in thousands USD
| 2007/2008 | 2008/2009 | 2009/2010 | 2010/2011 | 2011/2012 | Shares | |
|---|---|---|---|---|---|---|
Non life | 6 975 412 | 5 863 972 | 7 692 664 | 9 400 887 | 10 199 734 | 15.55% |
Life | 50 478 798 | 42 848 955 | 58 983 379 | 64 393 790 | 55 376 210 | 84.45% |
Grand total | 57 454 210 | 48 712 926 | 66 676 043 | 73 794 676 | 65 575 944 | 100% |
in thousands USD 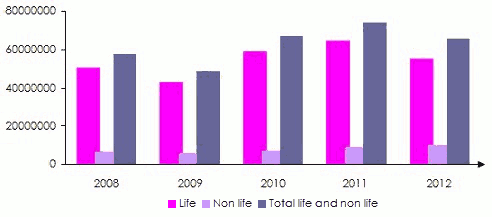
Russia
 St. Basil’s Cathedral, Moscow © Alvesgaspar [8], CC BY-SA 3.0 [5] St. Basil’s Cathedral, Moscow © Alvesgaspar [8], CC BY-SA 3.0 [5] |
Insurance is not a new activity in Russia since its beginnings date back to the late 18th century and the era of Catherine II. It started with a long process of development which culminated at the end of the 1917 Revolution with the nationalization of the entire sector. It was not until 1988 that the state monopoly and that of the national company Ingosstrakh came to an end. Private companies, are henceforth authorized, to get established. Transforming the insurance landscape has been laborious while renovation work is great: new insurance code in 1992, privatization of Ingosstrakh in 2001, introducing the obligation of motor third party liability insurance in 2003, etc.
By the end of 2012, the number of insurers registered on the market was only 458, compared to 918 in 2006 and several thousands in the 1990s. The introduction of a minimum capital in 2006 and the obligation of splitting life and non-life activities into two separate entities have contributed to the decline in the number of players on the market. On the other hand, licenses have been suspended and insurers have merged, but the majority of insurance companies remain poorly capitalized.
Compared to other markets undergoing transition, the evolution of the Russian market remains particularly slow and difficult. This is due to the huge undertaking required to overhaul the sector in depth. The transition period is now over, yet public mistrust of the insurance business lingers on.
Penetration and density rates
All experts are unanimously confident about the immense growth potential of the insurance sector in the country. The low penetration rate of 1.3% in 2012, caused mainly by the skepticism of consumer, means there is significant margin for improvement.
Large neighboring countries such as Poland (3.90%) or Ukraine (2.19%) have much higher penetration rates than Russia.
| Life | Non life | Total | ||||
|---|---|---|---|---|---|---|
| Density in USD | Penetration in % | Density in USD | Penetration in % | Density in USD | Penetration in % | |
| 2006 | 4 | 0.1% | 146.9 | 2.3% | 150.9 | 2.4% |
| 2007 | 6.1 | 0.1% | 203.3 | 2.4% | 209.4 | 2.5% |
| 2008 | 5.4 | 0% | 268.1 | 2.3% | 273.5 | 2.3% |
| 2009 | 4.5 | 0% | 276.4 | 2.5% | 280.9 | 2.5% |
| 2010 | 6.4 | 0% | 290.4 | 2.3% | 296.8 | 2.3% |
| 2011 | 8 | 0.1% | 295 | 2.3% | 303 | 2.4% |
| 2012 | 12 | 0.1% | 170 | 1.2% | 182 | 1.3% |
Source: Sigma, Swiss Re
The insurance distribution network
 World Trade Centre, Moscow © Bradmoscu [9], CC BY-SA 3.0 [10] World Trade Centre, Moscow © Bradmoscu [9], CC BY-SA 3.0 [10] |
In Russia, despite the high rates of commission allocated by companies to general agents, the latter control 50% of the premiums written in non-life insurance.
Direct sale comes as the second channel of marketing insurance with 37% of premiums volumes. Brokers are there only for major corporates, while new technologies are scarcely used, just like bancassurance whose role is minor.
Evolution of life and non life premiums
The turnover posted by all insurers in 2012 amounted to 26 billion USD. The non-life sector dominates with 93.35% of market shares, while life insurance is struggling to take off, accounting for just 6.65% of sales.
in millions USD
| 2008 | 2009 | 2010 | 2011 | 2012 | 2012 shares | ||||||
|---|---|---|---|---|---|---|---|---|---|---|---|
| In RUB | In USD | In RUB | In USD | In RUB | In USD | In RUB | In USD | In RUB | In USD | ||
Life | 19 425 | 664 | 15 921 | 526 | 22 534 | 738 | 34 826 | 1185 | 53 824 | 1732 | 6.65% |
Non life | 535 575 | 18 322 | 497 679 | 16 448 | 533 273 | 17 475 | 630 198 | 21 449 | 755 236 | 24 296 | 93.35% |
Total market | 555 000 | 18 986 | 513 600 | 16 974 | 555 807 | 18 213 | 665 024 | 22 634 | 809 060 | 26 028 | 100% |
RUB: Ruble Sources: Sigma, Swiss Re et l’assureur Ingosstrakh
The top 10 insurers in 2012*
in millions USD 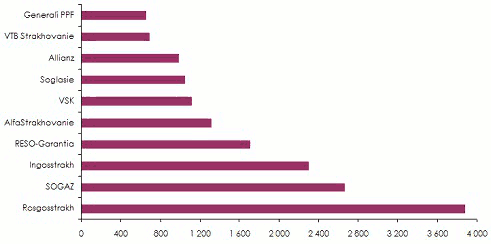 *Estimates of Atlas
Evolution of the first 10 insurers’ market shares: 2010-2012
in billions USD 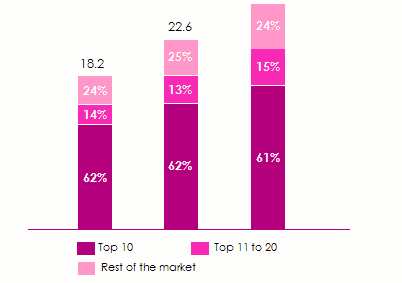 Sources: Sigma, Swiss Re et KPMG
Turnover’s breakdown per class of business
Like most developing countries, it is the motor class which dominates, accounting for 30% of the market in 2012. Property damage and health classes follow with 28% and 17% respectively.
The results of mandatory risks (motor, passengers transport, hazardous industrial risks) are poor. Because of the underpricing of risks, the loss ratios of these classes reach and sometimes exceed 90%, which highlights very high combined ratios.
In the life sector, insurance difficulties result from the Russians’ lack of confidence in their financial system and from the high rate of inflation, which is likely to discourage financial savings.
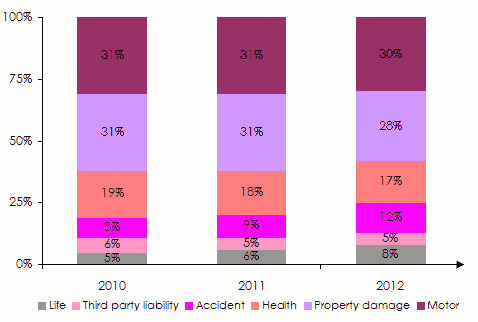 Sources: KPMG
A booming sector
Despite the slow pace of reforms, the sector has been on a steady growth in terms of premium volume since 2010. It is the strong economic recovery of the country as of 2010 that boosted the market turnover.
| 2009 | 2010 | 2011 | 2012 | |
|---|---|---|---|---|
Growth of premiums in% | -7.4% | +8.13% | +19.65% | +21.66% |
Evolution of GDP in % | -7.8% | +4% | +4.3% | +3.8% |
Inflation rate in % | +11.8% | +7.1% | +9% | +6% |
Source: Sigma, Swiss Re
Commonalities to insurance markets in the BRICs
- Market structure is similar. Dominance, with the exception of India, of non-life business in which motor, and thus compulsory insurance schemes in general, play a key role.
- Most people are not convinced about the usefulness of insurance.
- The reform package introduced is relatively fast, even if this fact is less obvious in Russia.
- The strong growth of GDP leads to a strong development of insurance.
- Highly concentrated markets. Despite a plethora of companies, the top five insurers have a significant share of the turnover.
Insurance in the BRICs in some figures
Population, GDP and inflation rate in 2012
| Ranking in terms of GDP | PIB in billions USD | Inflation rate | Population (millions) | |
|---|---|---|---|---|
China | 2 | 8 303 | 2.60% | 1 372.3 |
Brazil | 7 | 2 252 | 5.40% | 198.6 |
Russia | 9 | 1 952 | 6% | 142.7 |
India | 11 | 1 679 | 8.50% | 1 249 |
Total BRIC | - | 14 186 | - | 1 962.6 |
Total World | - | 70 960 | - | 7 034.6 |
Source: Sigma. Swiss Re
Insurance penetration in % of GDP in 2012
| Life | Non life | Life and non life | World ranking (life and non life) | |
|---|---|---|---|---|
India | 3.20% | 0.80% | 4.00% | 38 |
Brazil | 2.00% | 1.70% | 3.70% | 42 |
China | 1.70% | 1.30% | 3.00% | 46 |
Russia | 0.10% | 1.20% | 1.30% | 73 |
Source: Sigma, Swiss Re
Insurance density per capita in 2012
in USD
| Life | Non life | Life and non life | World ranking (life and non life) | |
|---|---|---|---|---|
Brazil | 225 | 189 | 414 | 45 |
Russia | 12 | 170 | 182 | 60 |
China | 103 | 76 | 179 | 61 |
India | 43 | 10 | 53 | 78 |
Source: Sigma, Swiss Re
Insurance premiums underwritten in the BRICs
in millions USD
| Life | Non life | Life and non life | |||||||
|---|---|---|---|---|---|---|---|---|---|
| World ranking | Premiums | World shares | World ranking | Premiums | World shares | World ranking | Premiums | World shares | |
China | 5 | 141 208 | 5.39% | 5 | 104 302 | 5.24% | 4 | 245 510 | 5.32% |
Brazil | 13 | 44 784 | 1.71% | 13 | 37 483 | 1.88% | 13 | 82 267 | 1.78% |
India | 10 | 55 376 | 2% | 24 | 10 199 | 0.51% | 15 | 65 575 | 1.43% |
Russia | 44 | 1 732 | 0.07% | 15 | 24 296 | 1.22% | 24 | 26 028 | 0.56% |
Total BRIC | - | 243 100 | 9.27% | - | 176 280 | 8.85% | - | 419 380 | 9.09% |
Total World | - | 2 620 864 | - | - | 1 991 650 | - | - | 4 612 514 | - |
Source: Sigma, Swiss Re and Insurance Regulatory and Development Authority for India
Exchange rate as at 31/12 | INR/USD | RUB/USD |
2008 | 0.02507 | 0.03421 |
2009 | 0.01932 | 0.03305 |
2010 | 0.02222 | 0.03277 |
2011 | 0.02208 | 0.03118 |
2012 | 0.01929 | 0.03285 |