Magazine date:
May 2016 Insurance sector in Turkey: turnover per kind of company: 2013-2014
in thousands USD| 2013 | 2014 | 2013/2014 evolution | 2014 shares | Grand total in % | ||
|---|---|---|---|---|---|---|
| Non life and composite companies(1) | ||||||
| 1 | ALLIANZ | 904 358 | 1 378 456 | 52.4% | 14.6% | 12.4% |
| 2 | AXA | 1 475 287 | 1 319 280 | -10.6% | 14% | 11.8% |
| 3 | Anadolu | 1 280 345 | 1 287 870 | 0.6% | 13.7% | 11.6% |
| 4 | Aksigorta(1) | 710 615 | 734 456 | 3.4% | 7.8% | 6.6% |
| 5 | MAPFRE Genel | 629 945 | 639 019 | 1.4% | 6.8% | 5.7% |
| 6 | GUNES | 501 356 | 519 734 | 3.7% | 5.5% | 4.7% |
| 7 | GROUPAMA | 454 341 | 453 351 | -0.2% | 4.8% | 4.1% |
| 8 | EUREKO | 367 420 | 343 374 | -6.5% | 3.6% | 3.1% |
| 9 | Ziraat | 264 307 | 301 396 | 14.0% | 3.2% | 2.7% |
| 10 | Sompo Japan | 258 802 | 294 358 | 13.7% | 3% | 2.6% |
Read also | Insurance companies in Turkey: 2020 ranking [4]
| 11 | ERGO | 262 637 | 288 488 | 9.8% | 3.1% | 2.6% |
| 12 | HDI | 221 768 | 250 477 | 12.9% | 2.7% | 2.2% |
| 13 | HALK | 219 016 | 230 508 | 5.2% | 2.4% | 2.1% |
| 14 | ZURICH | 178 963 | 187 745 | 4.9% | 2% | 1.7% |
| 15 | NEOVA | 119 574 | 163 011 | 36.3% | 1.7% | 1.5% |
| 16 | RAY | 164 972 | 162 879 | -1.3% | 1.7% | 1.5% |
| 17 | AIG | 128 478 | 128 780 | 0.2% | 1.4% | 1.2% |
| 18 | EGE | 95 729 | 105 780 | 10.5% | 1.1% | 0.9% |
| 19 | ANKARA | 81 015 | 94 949 | 17.2% | 1% | 0.9% |
| 20 | AVIVA | 126 257 | 81 653 | -35.3% | 0.9% | 0.7% |
| 21 | ISIK | 85 709 | 70 478 | -17.8% | 0.7% | 0.6% |
| 22 | Generali(1) | 40 839 | 67 744 | 65.9% | 0.8% | 0.6% |
| 23 | Liberty | 70 172 | 57 930 | -17.4% | 0.6% | 0.5% |
| 24 | DUBAI Starr | 37 262 | 53 424 | 43.4% | 0.6% | 0.5% |
| 25 | SBN | 37 306 | 43 227 | 15.9% | 0.5% | 0.4% |
| 26 | Turk Nippon | 20 686 | 30 979 | 49.8% | 0.3% | 0.3% |
| 27 | ACE | 26 310 | 25 769 | -2.1% | 0.3% | 0.2% |
| 28 | COFACE | 22 780 | 25 423 | 11.6% | 0.3% | 0.2% |
| 29 | Euler Hermes | 16 472 | 21 948 | 33.2% | 0.2% | 0.2% |
| 30 | Demir | 13 511 | 13 408 | -0.8% | 0.1% | 0.1% |
| 31 | Koru | 15 932 | 12 792 | -19.7% | 0.1% | 0.1% |
| 32 | BNP Paribas Cardif | 10 363 | 11 817 | 14% | 0.1% | 0.1% |
| 33 | DOGA | - | 11 348 | - | 0.1% | 0.1% |
| 34 | HUR | 20 587 | 9 099 | -55.8% | 0.1% | 0.1% |
| 35 | Atradius | 5 562 | 7 112 | 27.9% | 0.1% | 0.1% |
| 36 | Orient | - | 3 472 | - | 0.05% | - |
| 37 | Turk P&I | 585 253 | 3 084 | -99.5% | 0.03% | 0.03% |
| 38 | TURINS | 418 | 1 817 | 334.4% | 0.02% | 0.02% |
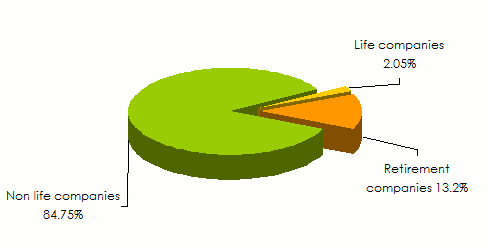
Total non life companies | 9 454 347 | 9 436 435 | -0.2% | 100% | 84.75% | |
| Life companies(2) | ||||||
|---|---|---|---|---|---|---|
| 1 | Acibadem | 143 423 | 178 429 | 24.4% | 75.8% | 1.6% |
| 2 | BNP Paribas Cardif Hayat | 27 098 | 27 835 | 2.7% | 11.8% | 0.2% |
| 3 | Demir Hayat | 23 743 | 23 664 | -0.3% | 10.1% | 0.2% |
| 4 | Mapfre Genel Yasam | 5 324 | 5 465 | 2.7% | 2.3% | 0.05% |
| 5 | CIV Hayat | 5 955 | -82 | -101.4% | - | - |
Total life companies(2) | 205 543 | 235 311 | 14.5% | 100% | 2.15% | |
| Companies specialised in retirement insurance (3) | ||||||
| 1 | Zoraat H/E | 374 747 | 264 655 | -29.4% | 18% | 2.4% |
| 2 | Anadolu H/E | 183 928 | 156 730 | -14.8% | 10.7% | 1.4% |
| 3 | ALLIANZ Y/E | 113 644 | 144 479 | 27.1% | 9.8% | 1.3% |
| 4 | GARANTI E/H | 138 808 | 136 623 | -1.6% | 9.3% | 1.2% |
| 5 | AVIVASA E/H | 108 439 | 110 714 | 2.1% | 7.5% | 1% |
| 6 | METLIFE E/H | 108 613 | 109 955 | 1.2% | 7.5% | 1% |
| 7 | HALK H/E | 131 078 | 102 156 | -22.1% | 7% | 0.9% |
| 8 | CIGNA Finans E/H | 94 058 | 89 985 | -4.3% | 6.1% | 0.8% |
| 9 | VAKIF Emeklilik | 105 045 | 79 522 | -24.3% | 5.4% | 0.7% |
| 10 | BNP Paribas Cardif Emeklilik | 34 987 | 57 670 | 64.8% | 3.9% | 0.5% |
| 11 | AEGON E/H | 41 548 | 57 364 | 38.1% | 3.9% | 0.5% |
| 12 | Groupama Emeklilik | 51 406 | 52 909 | 2.9% | 3.6% | 0.5% |
| 13 | ALLIANZ H/E | 46 510 | 46 953 | 1% | 3.2% | 0.4% |
| 14 | NN H/E | 32 113 | 32 707 | 1.9% | 2.2% | 0.3% |
| 15 | AXA H/E | 46 106 | 15 534 | -66.3% | 1.1% | 0.2% |
| 16 | FIBA E/H | 3 456 | 3 868 | 11.9% | 0.3% | 0.04% |
| 17 | ERGO E/H | 6 180 | 3 644 | -41% | 0.2% | 0.03% |
| 18 | KATILIM E/H | - | 1 452 | - | 0.1% | 0.02% |
| 19 | ASYA E/H | 224 | 1 131 | 405% | 0.1% | 0.01% |
Total retirement companies(3) | 1 620 890 | 1 468 051 | -9.4% | 100% | 13.2% | |
Grand total | 11 280 780 | 11 139 797 | -1.2% | 100% | ||
(2)companies underwriting life, health and accident insurance
(3)companies underwriting retirement, life and health insurance H/E: Hayat ve Emeklilik=Life and retirement
Y/E: Yasam ve Emeklilik=pension and retirement
Shares of the Turkish insurance market per kind of market company in 2014
Insurance sector in Turkey: Turnover per class of business: 2013-2014
in thousands USD| 2013 | 2014 | 2013/2014 evolution | 2014 shares | |
|---|---|---|---|---|
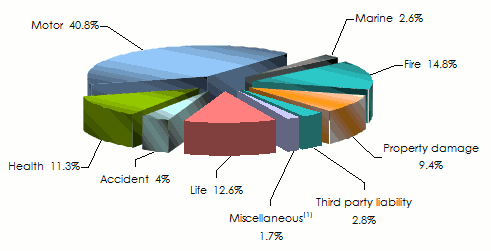
Accident | 411 520 | 444 105 | 7.9% | 4% |
Health | 1 151 211 | 1 255 640 | 9.1% | 11.3% |
Motor | 4 847 639 | 4 550 030 | -6.1% | 40.8% |
Marine | 278 267 | 294 889 | 6% | 2.6% |
Fire | 1 548 200 | 1 648 254 | 6.5% | 14.8% |
Property damage | 1 018 214 | 1 041 194 | 2.3% | 9.4% |
Third party liability | 269 844 | 315 701 | 17% | 2.8% |
Miscellaneous(1) | 175 164 | 184 330 | 5.2% | 1.7% |
Total non life(2) | 9 700 059 | 9 734 143 | 0.4% | 87.4% |
Life(3) | 1 580 721 | 1 405 654 | -11.1% | 12.6% |
Grand total | 11 280 780 | 11 139 797 | -1.2% | 100% |
Breakdown of 2014 turnover per class of business
 (1)including credit, bond, financial loss, legal protection and assistance
 (2)including life and non life underwritings
(3)including life, accident and health underwritings
Exchange rate as at TRY/USD au 31/12 | 2013 | 2014 |
0.46563 | 0.42860 |