Magazine date:
Oct 2017 The Moroccan insurance market: ranking of insurers according to 2016 turnover
in thousands| 2015 turnover(1) | 2016 turnover(1) | 2016 shares | |||
|---|---|---|---|---|---|
| In MAD(2) | In USD | In MAD(2) | In USD | ||
WAFA Assurance | 6 407 400 | 650 864 | 7 314 000 | 726 426 | 20.8% |
Royale Marocaine d'Assurances | 5 547 600 | 563 525 | 5 860 000 | 582 015 | 16.7% |
SAHAM Assurance | 3 773 000 | 383 261 | 4 392 000 | 436 213 | 12.5% |
AXA Assurance Maroc | 3 887 200 | 394 862 | 3 928 000 | 390 129 | 11.2% |
Mutuelle Attamine Chaabi (MAC) | 209 600 | 21 291 | 2 739 000 | 272 037 | 7.8% |
ATLANTA | 1 760 600 | 178 842 | 1 939 000 | 192 581 | 5.5% |
SANAD | 1 657 000 | 168 318 | 1 751 000 | 173 909 | 5.0% |
Marocaine Vie | 1 360 200 | 138 169 | 1 484 000 | 147 391 | 4.2% |
Mutuelle Centrale Marocaine d'Assurance | 1 606 800 | 163 219 | 1 315 000 | 130 606 | 3.8% |
Allianz Maroc(3) | 1 250 000 | 126 975 | 1 212 000 | 120 376 | 3.5% |
Mutuelle Agricole Marocaine d'Assurance | 846 900 | 86 028 | 858 000 | 85 217 | 2.4% |
Compagnie d'Assurances Transport | 631 200 | 64 117 | 634 000 | 62 969 | 1.8% |
SAHAM Assistance | 333 200 | 33 846 | 470 000 | 46 680 | 1.4% |
Maroc Assistance Internationale | 432 600 | 43 944 | 435 000 | 43 204 | 1.3% |
Mutuelle d'Assurances des Transporteurs | 265 100 | 26 929 | 293 000 | 29 101 | 0.8% |
WAFA IMA Assistance | 176 700 | 17 949 | 209 000 | 20 758 | 0.6% |
Euler Hermes ACMAR | 108 300 | 11 001 | 116 000 | 11 521 | 0.3% |
AXA Assistance Maroc | 152 400 | 15 481 | 107 000 | 10 627 | 0.3% |
COFACE Maroc | 17 900 | 1 818 | 46 000 | 4 569 | 0.1% |
Total | 30 423 700 | 3 090 439 | 35 102 000 | 3 486 329 | 100% |
(2) Moroccan Dirham
(3) Former Zurich Assurance Maroc
Read also | Moroccan insurance market: 2018 results [4]
The Moroccan insurance market: breakdown of turnover per life and non life class of business (2015-2016)
in thousands| 2015 turnover | 2016 turnover | 2016 shares | |||
|---|---|---|---|---|---|
| In MAD(1) | In USD | In MAD(1) | In USD | ||
| Non life insurance | |||||
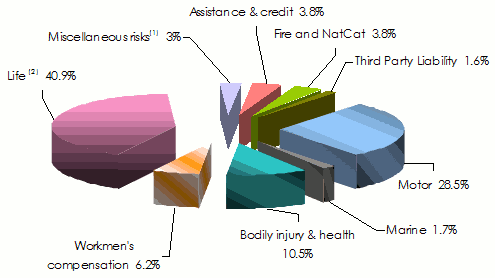
Health and bodily injury | 3 359 460 | 341 254 | 3 652 800 | 362 796 | 10.5% |
Motor | 9 514 180 | 966 450 | 9 953 810 | 988 612 | 28.5% |
Fire and natural catastrophes | 1 312 120 | 133 285 | 1 318 430 | 130 946 | 3.8% |
Third party liability | 544 390 | 55 299 | 550 170 | 54 643 | 1.6% |
Marine | 552 300 | 56 103 | 577 990 | 57 406 | 1.7% |
Assistance and credit | 1 180 690 | 119 934 | 1 331 140 | 132 209 | 3.8% |
Workmen's compensation | 2 090 930 | 212 397 | 2 174 090 | 215 931 | 6.2% |
Technical risks | 393 680 | 39 990 | 329 350 | 32 711 | 0.9% |
Other operations | 701 210 | 71 229 | 734 470 | 72 948 | 2.1% |
Total non life | 19 648 960 | 1 995 941 | 20 622 250 | 2 048 202 | 59.1% |
| Life insurance | |||||
Savings | 7 485 160 | 760 343 | 11 086 980 | 1 101 159 | 31.7% |
Death | 2 580 910 | 262 169 | 2 684 970 | 266 671 | 7.7% |
Variable life assurance | 460 140 | 46 741 | 493 560 | 49 020 | 1.4% |
Other life operations | 33 240 | 3 376 | 27 060 | 2 688 | 0.1% |
Total life | 10 559 450 | 1 072 629 | 14 292 570 | 1 419 538 | 40.9% |
Grand total | 30 208 410 | 3 068 570 | 34 914 820 | 3 467 740 | 100% |
Breakdown of turnover per class of business in 2016
 (1) including savings, death, variable life assurance and other life operations
 (2) including technical risks and other non life operations
The Morrocan insurance market: breakdown of incurred losses per non life class of business (2015-2016)
in thousands| Incurred losses(1) 2015 | Incurred losses(1) 2016 | |||
|---|---|---|---|---|
| In MAD(2) | In USD | In MAD(2) | In USD | |
Health and bodily injury | 2 738 120 | 278 138 | 2 979 800 | 295 954 |
Motor | 5 550 530 | 563 823 | 6 326 240 | 628 322 |
Fire and Natural catastrophes | 531 280 | 53 967 | 682 850 | 67 821 |
Third party liability | 222 100 | 22 561 | 281 190 | 27 928 |
Marine | 251 160 | 25 513 | 504 740 | 50 131 |
Assistance and credit | 642 170 | 65232 | 856 440 | 85 061 |
Workmen's compensation | 1 735 800 | 176 323 | 1 686 990 | 167 552 |
Technical risks | - 4 510 | -458 | 45 570 | 4 526 |
Other operations | 446 520 | 45 357 | 920 080 | 91 382 |
Total non life | 12 113 170 | 1 230 456 | 14 283 900 | 1 418 677 |
(2) Moroccan Dirham
The Moroccan insurance market: loss ratio and combined ratio per non life class of business (2015-2016)
| Loss ratio | Combined ratio | |||
|---|---|---|---|---|
| 2015 | 2016 | 2015 | 2016 | |
Health and bodily injury | 81.7% | 81.4% | 109.0% | 106.4% |
Motor | 59.3% | 63.7% | 89.2% | 93.7% |
Fire and Natural catastrophes | 40.2% | 52.1% | 70.0% | 81.9% |
Third party liability | 41.1% | 51.6% | 74.3% | 87.0% |
Marine | 45.5% | 87.1% | 77.1% | 124.2% |
Assistance and credit | 55.4% | 65.2% | 92.2% | 102.6% |
Workmen's compensation | 71.6% | 80.0% | 106.5% | 114.7% |
Technical risks | -1.3% | 12.3% | 20.4% | 42.8% |
Other operations | 64.6% | 126.3% | 91.3% | 157.7% |
Total non life | 61.2% | 69.7% | 91.1% | 100.0% |
Exchange rate MAD/USD as at 31/12 | 2015 | 2016 |
0.10158 | 0.09932 |