Magazine date:
Oct 2017 
Burkina Faso insurance market features 2016
- Regulatory authority: Ministry of economy and finance
insurance department - Life and non life premiums (2016): 106 million USD
- Insurance density (2016): 5.68 USD
- Insurance penetration rate (2016): 0.87%
Burkina Faso insurance market structure 2016
- Non life insurance companies: 8
- Life insurance companies: 7
- Reinsurance company: 1
Profile
Area: 274 400 Km2- Population (1) (2016): 18.65 million inhabitants
- GDP (2016): 12.12 billion USD
- GDP per capita (2016): 650 USD
- Inflation rate (2016) (2): 0.6%
- Main economic sectors: mining (copper, iron, zinc), agriculture (corn, rice, cotton…)
Major cities (3)
(per number of inhabitants in 2012)
- Ouagadougou (capital): 1 915 102
- Bobo-Dioulasso: 813 610
(2) International Monetary Fund (IMF)
(3)The national institute of statistics and demography (INSD)
The insurance industry in Burkina Faso: evolution of life and non life turnover (2012-2016)
in thousands| 2012 | 2013 | 2014 | 2015 | 2016 | ||||||
|---|---|---|---|---|---|---|---|---|---|---|
| FCFA | USD | FCFA | USD | FCFA | USD | FCFA | USD | FCFA | USD | |
| Non life | 28 762 377 | 58 071 | 31 759 064 | 66 631 | 33 024 539 | 61 194 | 38 623 974 | 64 348 | 43 753 821 | 70 356 |
| Life | 14 065 874 | 28 399 | 15 308 532 | 32 117 | 17 996 530 | 33 348 | 19 288 960 | 32 135 | 22 239 876 | 35 762 |
| Total | 42 828 251 | 86 470 | 47 067 596 | 98 748 | 51 021 069 | 94 542 | 57 912 934 | 96 483 | 65 993 697 | 106 118 |
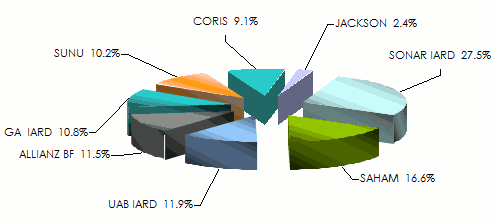
The insurance industry in Burkina Faso: Evolution of turnover per non life company (2014-2016)
in thousands| 2014 | 2015 | 2016 | 2016 shares | ||||
|---|---|---|---|---|---|---|---|
| FCFA(1) | USD | FCFA(1) | USD | FCFA(1) | USD | ||
SONAR IARD | 9 866 336 | 18 282 | 10 709 559 | 17 842 | 12 051 714 | 19 379 | 27.5% |
SAHAM | 5 740 027 | 10 636 | 6 209 109 | 10 345 | 7 275 846 | 11 700 | 16.6% |
UAB IARD | 2 347 332 | 4 349 | 4 096 750 | 6 825 | 5 214 539 | 8 385 | 11.9% |
ALLIANZ BF | 4 402 744 | 8 158 | 5 013 961 | 8 353 | 5 036 958 | 8 099 | 11.5% |
GA IARD | 4 182 205 | 7 750 | 4 624 799 | 7 705 | 4 705 188 | 7 566 | 10.8% |
SUNU | 2 821 760 | 5 229 | 3 569 221 | 5 946 | 4 459 175 | 7 170 | 10.2% |
CORIS | 2 795 967 | 5 181 | 3 384 944 | 5 640 | 3 959 936 | 6 368 | 9.1% |
JACKSON | 868 168 | 1 609 | 1 015 631 | 1 692 | 1 050 465 | 1 689 | 2.4% |
Total | 33 024 539 | 61 194 | 38 623 974 | 64 348 | 43 753 821 | 70 356 | 100% |
Market shares per non life insurance company in 2016
The insurance industry in Burkina Faso: turnover per class of business and per non life insurance company in 2016
in thousands FCFA| Bodily injury and health | Motor | Fire and property damage | RC générale | Marine | Other direct risks | Acceptances | Total | |
|---|---|---|---|---|---|---|---|---|
SONAR IARD | 2 490 071 | 3 726 993 | 1 246 587 | 336 400 | 1 021 000 | 3 065 823 | 164 840 | 12 051 714 |
SAHAM | 1 831 080 | 2 718 520 | 1 200 270 | 277 852 | 743 450 | 504 250 | 424 | 7 275 846 |
UAB IARD | 2 310 262 | 2 307 240 | 284 668 | 64 560 | 207 270 | 40 539 | - | 5 214 539 |
ALLIANZ BF | 1 024 200 | 2 056 478 | 721 646 | 315 521 | 734 153 | 184 960 | - | 5 036 958 |
GA IARD | 1 202 221 | 2 864 926 | 188 429 | - | 195 333 | 254 279 | - | 4 705 188 |
SUNU | 1 654 858 | 1 609 932 | 680 950 | 241 634 | 221 001 | 2 720 | 48 080 | 4 459 175 |
CORIS | 492 350 | 2 872 689 | 163 716 | 56 953 | 278 995 | 59 255 | 35 978 | 3 959 936 |
JACKSON | 63 349 | 829 531 | 65 533 | 10 960 | 52 313 | 28 779 | - | 1 050 465 |
Total | 11 068 391 | 18 986 309 | 4 551 799 | 1 303 880 | 3 453 515 | 4 140 605 | 249 322 | 43 753 821 |
| Bodily injury and health | Motor | Fire and property damage | General TPL | Marine | Other direct risks | Acceptances | Total | |
|---|---|---|---|---|---|---|---|---|
SONAR IARD | 4 004 | 5 993 | 2 005 | 541 | 1 642 | 4 930 | 265 | 19 380 |
SAHAM | 2 944 | 4 371 | 1 930 | 447 | 1 195 | 811 | 1 | 11 699 |
UAB IARD | 3 715 | 3 710 | 458 | 104 | 333 | 65 | - | 8 385 |
ALLIANZ BF | 1 647 | 3 307 | 1 160 | 507 | 1 181 | 297 | - | 8 099 |
GA IARD | 1 933 | 4 607 | 303 | - | 314 | 409 | - | 7 566 |
SUNU | 2 661 | 2 589 | 1 095 | 389 | 355 | 4 | 77 | 7 170 |
CORIS | 792 | 4 619 | 263 | 92 | 449 | 95 | 58 | 6 368 |
JACKSON | 102 | 1 334 | 105 | 18 | 84 | 46 | - | 1 689 |
Total | 17 798 | 30 530 | 7 319 | 2 098 | 5 553 | 6 657 | 401 | 70 356 |
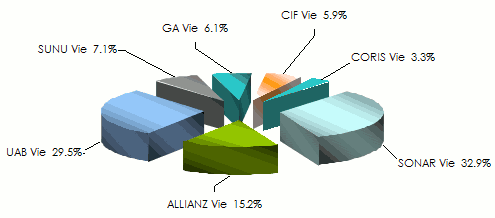
The insurance industry in Burkina Faso: turnover per class of business and per life insurance company in 2016
in thousands| Individual life policies | Group life insurance | Acceptances | Total | 2016 shares | |||||
|---|---|---|---|---|---|---|---|---|---|
| FCFA (1) | USD | FCFA (1) | USD | FCFA (1) | USD | FCFA (1) | USD | ||
SONAR Vie | 3 746 235 | 6 024 | 3 560 486 | 5 725 | - | - | 7 306 721 | 11 749 | 32.9% |
UAB Vie | 5 285 969 | 8 500 | 1 283 677 | 2 064 | - | - | 6 569 646 | 10 564 | 29.5% |
ALLIANZ Vie | 3 389 789 | 5 451 | - | - | - | - | 3 389 789 | 5 451 | 15.2% |
SUNU Vie | 94 461 | 152 | 1 306 040 | 2 100 | 172 580 | 278 | 1 573 081 | 2 530 | 7.1% |
GA Vie | 185 002 | 298 | 1 174 119 | 1 888 | - | - | 1 359 121 | 2 186 | 6.1% |
CIF Vie | 263 724 | 424 | 1 038 107 | 1 669 | - | - | 1 301 831 | 2 093 | 5.9% |
CORIS Vie | 11 974 | 19 | 727 713 | 1 170 | - | - | 739 687 | 1 189 | 3.3% |
Total | 12 977 154 | 20 868 | 9 090 142 | 14 616 | 172 580 | 278 | 22 239 876 | 35 762 | 100% |
Market shares per life insurance company in 2016
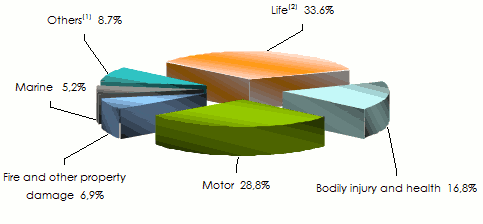
The insurance industry in Burkina Faso: turnover per class of business in 2016
in thousands| 2016 turnover | 2016 shares | ||
|---|---|---|---|
| In FCFA(1) | In USD | ||
Bodily injury and health | 11 068 391 | 17 798 | 16.8% |
Motor | 18 986 309 | 30 530 | 28.8% |
Fire and property damage | 4 551 799 | 7 319 | 6.9% |
General third party liability | 1 303 880 | 2 097 | 2.0% |
Marine | 3 453 515 | 5 553 | 5.2% |
Other direct risks | 4 140 605 | 6 658 | 6.3% |
Acceptances | 249 322 | 401 | 0.4% |
Total non life | 43 753 821 | 70 356 | 66.4% |
Individual life policies | 12 977 154 | 20 867 | 19.6% |
Group life insurance | 9 090 142 | 14 617 | 13.8% |
Acceptances | 172 580 | 278 | 0.2% |
Total life | 22 239 876 | 35 762 | 33.6% |
Grand total | 65 993 697 | 106 118 | 100% |
Market shares per class of business in 2016
Exchange rate FCFA/USD as at 31/12 | 2012 | 2013 | 2014 | 2015 | 2016 |
0.002019 | 0.002098 | 0.001853 | 0.001666 | 0.00161 |