Magazine date:
Oct 2018 
Insurance market features
- Regulatory authority : Insurance and Pensions Commission
- Life and non life premiums (2017): 602 million USD
- Insurance density (2017): 36.44 USD
- Penetration rate (2017): 3.37%
The Zimbabwean insurance market structure in 2017
| Market actors | Life | Non life | Total |
|---|---|---|---|
| Insurance companies | 11 | 20 | 31 |
| Reinsurance companies | 5 | 8 | 13 |
| Insurance brokers | - | 31 | 31 |
| Reinsurance brokers | - | 6 | 6 |
| Total | 16 | 65 | 81 |
Identity
- Area : 390 757 Km2
- Population(1) (2017) : 16 529 904 inhabitants
- GDP(1) (2017) : 17.846 billion USD
- GDP per capita (2017) : 1079.6 USD
- GDP growth rate (2017) : 3.4%
- Inflation rate (1) (2017) : 3.8%
- Main economic sectors : mining (coal, gold, platinum,
copper, nickel, tin, clay, ore), metallurgical industry,
wood, chemicals and fertilizers, clothing and footwear,
food industry and beverages.
(1) Source World Bank
Major cities
(per inhabitants)
- Harare (capital): 3 465 389
- Bulawayo: 1 200 337
- Mutare: 291 943
The Zimbabwean insurance market: Evolution of life and non life premiums 2013-2017
Figures in thousands USD| 2013 | 2014 | 2015 | 2016 | 2017 | |
|---|---|---|---|---|---|
Life | 258 308 | 299 633 | 332 075 | 346 553 | 365 997 |
Non life | 207 690 | 208 020 | 213 440 | 215 970 | 236 468 |
Total | 465 998 | 507 653 | 545 515 | 562 523 | 602 465 |
The Zimbabwean insurance market: Turnover per non life insurance company 2016-2017
Figures in thousands USDCompany | 2017 | 2016 | 2016-2017 evolution | 2017 market shares |
|---|---|---|---|---|
Old Mutual (1) | 37 888 | 36 848 | 2.82% | 16.02% |
Alliance | 31 674 | 32 352 | -2.09% | 13.39% |
Nicoz Diamond | 31 585 | 29 330 | 7.69% | 13.36% |
Zimnat Lion | 28 278 | 24 869 | 13.71% | 11.96% |
FBC (2) | 18 970 | 18 600 | - | 8.02% |
Cell | 17 629 | 18 666 | -5.55% | 7.46% |
Champions | 11 642 | 10 562 | 10.23% | 4.92% |
Tetrad Hail | 10 768 | 6 837 | 57.50% | 4.55% |
C.B.Z | 10 444 | 10 221 | 2.18% | 4.42% |
Regal | 8 858 | 6 950 | 27.46% | 3.75% |
Evolution | 5 428 | 4 747 | 14.35% | 2.30% |
Tristar | 5 006 | 3 836 | 30.50% | 2.12% |
Clarion | 3 868 | 3 239 | 19.41% | 1.64% |
Sanctuary | 3 536 | 2 161 | 63.60% | 1.50% |
Safel | 2 960 | 364 | 713.11% | 1.25% |
Credsure | 2 367 | 2 283 | 3.70% | 1.00% |
Allied | 1 665 | 1 491 | 11.68% | 0.70% |
Quality | 1 369 | 1 152 | 18.84% | 0.58% |
Hamilton | 1 269 | 1 122 | 13.13% | 0.54% |
ECGC | 1 262 | 340 | 271.30% | 0.53% |
Total | 236 468 | 215 970 | 9.49% | 100% |
(1) Ex RM Insurance (2) Eagle was renamed FBC
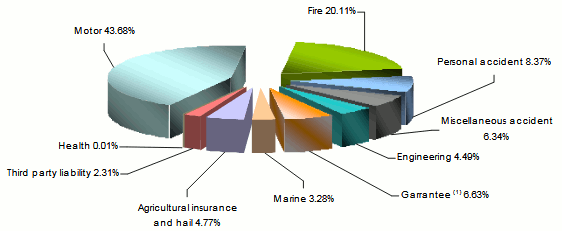
The Zimbabwean insurance market: Non life insurance turnover per class of business 2016-2017
Figures in thousands USDClass of business | 2017 | 2016 | 2017 market shares |
|---|---|---|---|
Motor | 10300 | 9144 | 43.68% |
Fire | 4563 | 4026 | 20.11% |
Personal accident | 1786 | 1927 | 8.37% |
Guarantee/bond/credit | .1689 | .1072 | .6.63% |
Miscellaneous accident | 1982 | 1166 | 6.34% |
Agricultural insurance and hail | 1274 | 539 | 4.77% |
Engineering | 1628 | 1272 | 4.49% |
Marine and aviation | 761 | 431 | 3.28% |
Third party liability | 465 | 393 | 2.31% |
Health | 19,7 | - | 0.01% |
Total non life | 23468 | 21970 | 100% |
Breakdown of non life insurance turnover per class of business in 2017
(1) including bond and credit
The Zimbabwean insurance market: Premiums and results per non life insurance company in 2017
Figures in thousands USDCompany | Net written premiums | Technical result | Net result |
|---|---|---|---|
Old Mutual | 30 542 | 3 723 | 12 882 |
Alliance | 12 831 | 1 650 | 1 608 |
Nicoz Diamond | 20 209 | 1 578 | 3 132 |
Zimnat Lion | 15 345 | 1 377 | 3 791 |
FBC | 8 472 | 682 | 991 |
Cell | 5 176 | 768 | 1 882 |
Champions | 9 988 | 1 068 | 1 268 |
Tetrad Hail | 4 581 | 1 982 | 1 665 |
C.B.Z | 5 584 | 1 441 | 2 292 |
Regal | 8 858 | 694 | 500 |
Evolution | 3 398 | 279 | 385 |
Tristar | 3 277 | -374 | -756 |
Clarion | 3 726 | 1 441 | 1 112 |
Sanctuary | 3 051 | 98 | 306 |
Safel | 2 945 | 918 | 734 |
Credsure | 1 171 | -293 | -82 |
Allied | 1 239 | 3 | 276 |
Quality | 1 176 | 66 | 1 144 |
Hamilton | 1 195 | -114 | 122 |
ECGC | 1 056 | 7 | 373 |
Total | 143 820 | 16 997 | 33 625 |
The Zimbabwean insurance market: Premiums, incurred losses and management expenses of non life companies in 2017
Figures in thousands USDCompany | Net earned premiums | Net incurred losses | Management expenses |
|---|---|---|---|
Old Mutual | 29 983 | 15 076 | 6 986 |
Alliance | 12 968 | 5 663 | 5 007 |
Nicoz Diamond | 19 707 | 9 578 | 5 352 |
Zimnat Lion | 14 955 | 7 316 | 4 654 |
FBC | 8 448 | 3 941 | 2 881 |
Cell | 5 247 | 2 025 | 2 709 |
Champions | 9 034 | 2 920 | 5 188 |
Tetrad Hail | 4 281 | 1 982 | 1 394 |
C.B.Z | 5 606 | 2 144 | 1 971 |
Regal | 8 097 | 758 | 3 446 |
Evolution | 3 395 | 1 540 | 1 063 |
Tristar | 3 193 | 1 300 | 1 907 |
Clarion | 3 580 | 9 | 1 530 |
Sanctuary | 2 745 | 879 | 1 397 |
Safel | 2 036 | 104 | 493 |
Credsure | 1 244 | 552 | 1 003 |
Allied | 1 142 | 390 | 590 |
Quality | 1 202 | 249 | 652 |
Hamilton | 1 000 | 314 | 713 |
ECGC | 973 | 266 | 668 |
Total | 138 837 | 57 006 | 49 604 |
The Zimbabwean insurance market: Technical ratios of non life insurance companies in 2017
Company | Net loss ratio | Management expenses ratio | Net combined ratio |
|---|---|---|---|
Old Mutual | 50.28% | 18.44% | 68.72% |
Alliance | 43.67% | 15.81% | 59.48% |
Nicoz Diamond | 48.60% | 16.94% | 65.55% |
Zimnat Lion | 48.92% | 16.46% | 65.38% |
FBC | 46.65% | 15.19% | 61.83% |
Cell | 38.59% | 15.37% | 53.96% |
Champions | 32.32% | 44.56% | 76.88% |
Tetrad Hail | 46.31% | 12.95% | 59.25% |
C.B.Z | 38.24% | 18.87% | 57.11% |
Regal | 9.37% | 38.90% | 48.27% |
Evolution | 45.37% | 19.59% | 64.95% |
Tristar | 40.70% | 38.10% | 78.80% |
Clarion | 0.25% | 39.56% | 39.81% |
Sanctuary | 32.01% | 39.52% | 71.54% |
Safel | 5.09% | 16.64% | 21.73% |
Credsure | 44.33% | 42.38% | 86.71% |
Allied | 34.12% | 35.42% | 69.54% |
Quality | 20.72% | 47.63% | 68.34% |
Hamilton | 31.45% | 56.14% | 87.60% |
ECGC | 27.37% | 52.91% | 80.27% |
Total | 41.06% | 20.98% | 62.04% |
The Zimbabwean insurance market: Life insurance turnover per company 2016-2017
Figures in thousands USDCompany | 2017 | 2016 | 2016-2017 evolution | 2017 market shares |
|---|---|---|---|---|
Old Mutual | 166 572 | 166 925 | -0.21% | 45.51% |
Nyaradzo | 95 424 | 81 395 | 17.24% | 26.07% |
First Mutual Life | 35 244 | 36 702 | -3.97% | 9.63% |
Zimnat | 21 956 | 18 306 | 19.94% | 6.00% |
Zb Life | 11 721 | 10 676 | 9.79% | 3.20% |
Fidelity | 11 214 | 13 035 | -13.97% | 3.06% |
Econetlife | 10 426 | 6 333 | 64.63% | 2.85% |
CBZ Life | 10 096 | 9 504 | 6.23% | 2.76% |
Getsure Life Assurance | 1 777 | 1 281 | 38.72% | 0.49% |
Heritage | 1 025 | 1 732 | -40.82% | 0.28% |
Evolution | 542 | 664 | -18.37% | 0.15% |
Total | 365 997 | 346 553 | 5.61% | 100% |
The Zimbabwean insurance market: Life insurance turnover per class of business 2016-2017
Figures in thousands USDClass of business | 2017 | 2016 | 2017 market shares |
|---|---|---|---|
Fund business | 152 983 | 142 387 | 41.80% |
Funeral insurance | 132 569 | 113 879 | 36.22% |
Others | 39 973 | 52 482 | 10.92% |
Term assurance | 16 086 | 15 863 | 4.40% |
Annuities | 9 439 | 9 057 | 2.58% |
Whole life insurance | 9 260 | 9 255 | 2.53% |
Endowment insurance | 3 012 | 1 800 | 0.82% |
Pure endowment | 2 675 | 1 830 | 0.73% |
Total | 365 997 | 346 553 | 100% |
Source: Insurance and Pensions Commission (IPEC)