Magazine date:
Jun 2019 
- Date of creation: March 28, 1918, South Africa
- Class of business: Non-life
- Network of distribution: 3 600 intermediairies and direct channels
- Rating: Standard & Poor’s: « BB+ » stable
- Regional presence: Africa, South Asia and Middle East
- Number of employees: 6 043
Santam in 2018
 |  |
VP Khanyile Chairman of the board of directors | Lizé Lambrechts Chief executive officer(CEO) |
Share capital | 7 147 000 USD |
Turnover | 2 297 000 000 USD |
Assets | 3 129 350 000 USD |
Shareholder’s equity | 649 837 000 USD |
Net result | 175 000 000 USD |
Non-life net loss ratio | 60.61% |
Non-life net expenses ratio | 37.63% |
Non-life net combined ratio | 98.24% |
Management
| Vusumuzi Phillip Khanyile | Chairman of the board of directors |
| Lizé Lambrechts | Chief executive officer (CEO) |
| Hennie Nel | Chief financial officer (CFO) |
| Keven Wright | Chief operating officer (COO) & IT |
| Asher Grevler | Corporate risk officer (CRO) |
| John Melville | Chief underwriting officer |
| Mokaedi Dilotsotlhe | Marketing manager |
Major shareholders
Sanlam | 61.5% |
Public Investment Corporation (SOC) | 5.44% |
Investec Asset Management (Pty) | 3.84% |
Old Mutual Life Assurance (South Africa) | 1.53% |
The Vanguard Group | 1.21% |
Liberty Group Ltd. (Investment Portfolio) | 1.04% |
Alexander Forbes Investments | 0.99% |
Prescient Investment Management (Pty) | 0.75% |
Dimensional Fund Advisors LP | 0.72% |
Goldman Sachs Asset Management Inter. | 0.69% |
Main technical highlights (2014-2018)
Figures in millions ZAR| 2014 | 2015 | 2016 | 2017 | 2018 | |
|---|---|---|---|---|---|
Gross written premiums | 22 710 | 24 319 | 25 909 | 29 720 | 33 109 |
Net written premiums | 17 635 | 18 884 | 19 772 | 21 693 | 24 068 |
Net earned premiums | 17 222 | 18 523 | 19 826 | 21 330 | 22 812 |
Net incurred losses | 10 878 | 11 510 | 12 911 | 14 066 | 13 827 |
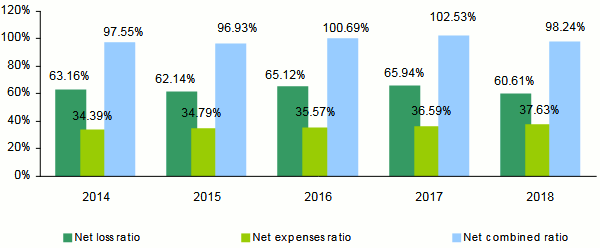
Net loss ratio (1) | 63.16% | 62.14% | 65.12% | 65.94% | 60.61% |
Management expenses | 6 064 | 6 570 | 7 033 | 7 937 | 9 056 |
Net expenses ratio (2) | 34.39% | 34.79% | 35.57% | 36.59% | 37.63% |
Net combined ratio (3) | 97.55% | 96.93% | 100.69% | 102.53% | 98.24% |
Net result | 1 667 | 2 464 | 1 331 | 1 807 | 2 529 |
(1) Net loss ratios = net incurred losses / net earned premiums
(2) Net management expenses ratio = management expenses / written premiums net of reinsurance
(3) Net combined ratio = net loss ratio / net expenses ratio
| 2014 | 2015 | 2016 | 2017 | 2018 | |
|---|---|---|---|---|---|
Gross written premiums | 1 957 | 1 579 | 1 898 | 2 406 | 2 297 |
Net written premiums | 1 520 | 1 226 | 1 449 | 1 756 | 1 670 |
Net earned premiums | 1 484 | 1 203 | 1 453 | 1 726 | 1 583 |
Net incurred losses | 938 | 747 | 946 | 1 139 | 959 |
Management expenses | 523 | 427 | 515 | 642 | 628 |
Net result | 144 | 160 | 98 | 146 | 175 |
Sanlam: Breakdown of turnover per class of business (2014-2018)
Figures in millions ZAR| Class of business | 2014 | 2015 | 2016 | 2017 | 2018 | Parts 2018 | 2017-2018 evolution |
|---|---|---|---|---|---|---|---|
Motor | 9 629 | 10 247 | 11 004 | 12 125 | 12 801 | 38.66% | 5.57% |
Property damage | 6 552 | 7 213 | 7 972 | 9 000 | 10 031 | 30.30% | 11.46% |
Engineering | 1 127 | 1 176 | 1 196 | 1 290 | 1 335 | 4.03% | 3.49% |
Third party liability | 1 246 | 1 327 | 1 202 | 1 227 | 1 250 | 3.78% | 1.87% |
Agricultural insurance | 1 044 | 840 | 984 | 829 | 729 | 2.20% | -12.06% |
Marine | 734 | 686 | 676 | 714 | 721 | 2.18% | 0.98% |
Accident and health | 350 | 371 | 374 | 482 | 535 | 1.62% | 11% |
Others (1) | 75 | 211 | 95 | 186 | 309 | 0.93% | 66% |
Total conventional insurance | 20 757 | 22 071 | 23 503 | 25 853 | 27 711 | 83.70% | 7.19% |
Alternative insurance | 1 953 | 2 248 | 2 406 | 3 867 | 5 398 | 16.30% | 39.59% |
Total | 22 710 | 24 319 | 25 909 | 29 720 | 33 109 | 100% | 11.40% |
| Class of business | 2014 | 2015 | 2016 | 2017 | 2018 |
|---|---|---|---|---|---|
Motor | 830 | 665 | 806 | 981 | 888 |
Property damage | 565 | 468 | 584 | 728 | 696 |
Engineering | 97 | 76 | 88 | 104 | 93 |
Third party liability | 107 | 86 | 88 | 99 | 87 |
Agricultural insurance | 90 | 55 | 72 | 67 | 51 |
Marine | 63 | 45 | 50 | 58 | 50 |
Accident and health | 30 | 24 | 27 | 39 | 37 |
Others (1) | 7 | 14 | 7 | 15 | 22 |
Total conventional insurance | 1 789 | 1 433 | 1 722 | 2 093 | 1 923 |
Alternative insurance | 168 | 146 | 176 | 313 | 375 |
Total | 1 957 | 1 579 | 1 898 | 2 406 | 2 297 |
(1) Including bond
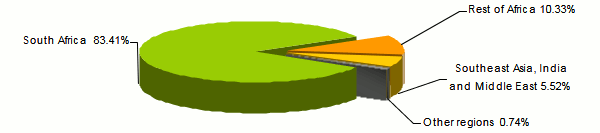
Sanlam: Breakdown of turnover per geographical area (2014-2018)
Figures in millions ZAR| 2014 | 2015 | 2016 | 2017 | 2018 | |
|---|---|---|---|---|---|
South Africa | 20 565 | 21 909 | 23 360 | 26 520 | 29 742 |
Rest of Africa (1) | 1 837 | 2 245 | 3 479 | 3 810 | 3 684 |
Southeast Asia, India and Middle East | 308 | 840 | 1 009 | 1 549 | 1 969 |
Others | - | - | - | 223 | 261 |
Total group | 22 710 | 24 994 | 27 848 | 32 102 | 35 656 |
Additional costs (2) | - | -675 | -1 939 | -2 382 | -2 547 |
Total | 22 710 | 24 319 | 25 909 | 29 720 | 33 109 |
(1) Including gross written premiums underwritten in Namibia
(2) Costs related to underlying investments in Sanlam Emerging Market (SEM) and SAN JV Proprietary Limited
| 2014 | 2015 | 2016 | 2017 | 2018 | |
|---|---|---|---|---|---|
South Africa | 1 772 | 1 423 | 1 712 | 2 147 | 2 064 |
Rest of Africa (1) | 158 | 146 | 255 | 308 | 256 |
Southeast Asia, India and Middle East | 27 | 55 | 74 | 125 | 137 |
Others | - | - | - | 18 | 18 |
Total group | 1 957 | 1 623 | 2 040 | 2 598 | 2 474 |
Additional costs (2) | - | -44 | -142 | -193 | -177 |
Total | 1 957 | 1 579 | 1 898 | 2 406 | 2 297 |
Geographical breakdown of 2018 turnover
Evolution of net ratios: 2014-2018
Breakdown of 2018 turnover per class of business
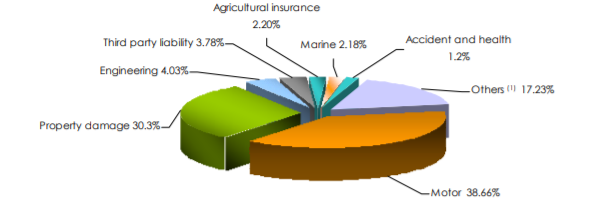
(1) Including bond and alternative insurance
Exchange rate as at 31/12 ZAR/USD | 2014 | 2015 | 2016 | 2017 | 2018 |
0.08619 | 0.06494 | 0.07327 | 0.08094 | 0.06939 |

Sanlam : Contact
| Head office | 1 Sportica Crescent, Tyger Valley Bellville, Western Cape 7530 |
| Phone | +27 21 915 7000 |
| Fax | +27 21 914 0700 |
info [at] santam [dot] co [dot] za | |
| Website | www.santam.co.za [4] |