Magazine date:
Dec 2019 
The Ivorian insurance market features
- Regulatory authority: Ministry of Economy and Finance, Insurance department
- Life and non-life premiums (2018): 628.947 million USD
- Insurance density (2018): 25.1 USD
- Penetration rate (2018): 1.46 %
The Ivorian insurance market structure in 2018
| Market players | Total |
|---|---|
Life insurance companies | 11 |
Non life insurance companies | 21 |
Composite companies | 8 |
Reinsurance companies | 4 |
| Total | 36 |
Identity
- Area (1) : 322 462 Km2
- Population (1) (2018) : 25 069 229 inhabitants
- GDP (1) (2018) : 43.007 billion USD
- GDP per capita (2018): 1 715.53 USD
- GDP growth rate (2018): 7.4%
- Inflation rate (1) (2018): 0.4%
- Main economic sectors: agriculture: cacao beans, cashew nuts, coffee and palm oil
Major cities (2)
(per number of inhabitants in 2014)
- Abidjan: 4 707 404
- Bouake: 608 138
- Daloa: 319 427
- Yamoussoukro (capital): 310 056
(1) Source World Bank
(2) Source : population.data
Read also | Insurance companies in Côte d’Ivoire: ranking 2019 [4]
The Ivorian insurance market: Evolution of premiums per life and non-life insurance (2014-2018)
Figures in thousands USD| 2014 | 2015 | 2016 | 2017* | 2018* | |
|---|---|---|---|---|---|
Life | 204 436 | 199 059 | 213 331 | 269 590 | 269 878 |
Non-life | 252 917 | 266 675 | 276 745 | 325 196 | 359 069 |
| Total | 457 353 | 465 734 | 490 076 | 594 786 | 628 947 |
* including acceptances
The Ivorian non-life insurance market: Turnover per company (2017-2018)
Figures in thousands| 2018 Gross Written Premium | 2017 Gross Written Premium | 2017-2018 evolution (1) | 2018 market shares | |||
|---|---|---|---|---|---|---|
| En FCFA | En USD | En FCFA | En USD | |||
SAHAM | 52 017 416 | 90 510 | 52 485 540 | 96 049 | -0.89% | 25.21% |
ALLIANZ | 22 465 151 | 39 089 | 18 840 445 | 34 478 | 19.24% | 10.89% |
SUNU | 21 539 616 | 37 479 | 18 086 300 | 33 098 | 19.09% | 10.44% |
AXA | 19 203 560 | 33 414 | 17 092 196 | 31 278 | 12.35% | 9.31% |
NSIA | 17 370 315 | 30 224 | 16 090 883 | 29 447 | 7.95% | 8.42% |
ATLANTIQUE | 13 014 906 | 22 646 | 11 451 224 | 20 956 | 13.66% | 6.31% |
STANE | 7 718 518 | 13 430 | 3 185 175 | 5 828 | 142.33% | 3.74% |
SIDAM | 7 409 609 | 12 893 | 5 016 521 | 9 180 | 47.70% | 3.59% |
MATCA | 6 630 524 | 11 537 | 5 815 867 | 10 643 | 14.01% | 3.21% |
SERENITY | 5 342 127 | 9 295 | 3 776 868 | 6 912 | 41.44% | 2.59% |
AMSA | 5 279 818 | 9 187 | 4 254 541 | 7 786 | 24.10% | 2.56% |
SONAM | 4 805 450 | 8 361 | 4 248 798 | 7 775 | 13.10% | 2.33% |
ATLAS | 4 493 020 | 7 818 | 4 619 784 | 8 454 | -2.74% | 2.18% |
2ACI | 4 433 935 | 7 715 | 3 643 074 | 6 667 | 21.71% | 2.15% |
GNA | 3 731 477 | 6 493 | 3 926 257 | 7 186 | -4.96% | 1.81% |
SAAR | 3 442 030 | 5 989 | 2 702 658 | 4 945 | 27.36% | 1.67% |
WAFA | 3 406 525 | 5 927 | 2 227 272 | 4 076 | 52.95% | 1.65% |
COMAR | 1 630 302 | 2 837 | 125 799 | 230 | 1195.96% | 0.79% |
LA LOYALE | 1 190 034 | 2 071 | NA | NA | - | 0.58% |
ATLANTA | 1 128 733 | 1 964 | 113 266 | 208 | 896.53% | 0.55% |
SMA BTP | 108 467 | 189 | NA | NA | - | 0.05% |
| Total | 206 361 533 | 359 069 | 177 702 468 | 325 196 | 16.13% | 100% |
* Growth rate in local currency
(1) NA: Not available
The Ivorian life insurance market: Tunover per company (2017-2018)
Figures in thousands| 2018 Gross Written Premium | 2017 Gross Written Premium | 2017-2018 evolution (1) | 2018 market shares | |||
|---|---|---|---|---|---|---|
| En FCFA | En USD | En FCFA | En USD | |||
SUNU VIE | 48 904 209 | 85 093 | 48 742 936 | 89 200 | 0.33% | 31.53% |
NSIA VIE | 27 321 431 | 47 539 | 28 853 111 | 52 801 | -5.31% | 17.62% |
SAHAM VIE | 24 338 564 | 42 349 | 23 510 881 | 43 025 | 3.52% | 15.69% |
ALLIANZ VIE | 23 420 102 | 40 751 | 20 857 325 | 38 169 | 12.29% | 15.10% |
BELIFE | 8 301 592 | 14 445 | 7 275 430 | 13 314 | 14.10% | 5.35% |
LA LOYALE VIE | 8 192 435 | 14 255 | 9 016 269 | 16 500 | -9.14% | 5.28% |
ATLANTIQUE VIE | 5 877 289 | 10 226 | 4 970 173 | 9 095 | 18.25% | 3.79% |
WAFA VIE | 4 738 504 | 8 245 | NA | NA | - | 3.06% |
SOMA VIE | 1 895 818 | 3 299 | 2 204 229 | 4 034 | -13.99% | 1.22% |
LEADWAY VIE | 1 106 134 | 1 925 | NA | NA | - | 0.71% |
SAAR VIE | 1 006 208 | 1 751 | 594 635 | 1 088 | 69.21% | 0.65% |
AXA VIE | NA | NA | 42 481 | 78 | ||
AAA VIE (2) | NA | NA | 1 249 381 | 2 286 | ||
| Total | 155 102 285 | 269 878 | 147 316 851 | 269 590 | - | 100% |
(1) Growth rate in local currency
(2) Company acquired by SONAM
NA: Not available
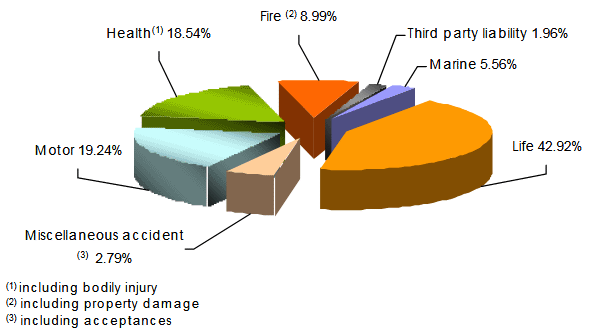
The Ivorian life insurance market: Turnover per class of business (2014-2018)
Figures in thousands USD| 2014 | 2015 | 2016 | 2017 | 2018 | Parts 2018 | |
|---|---|---|---|---|---|---|
Motor | 82 447 | 90 339 | 98 726 | 109 500 | 121 039 | 19.24% |
Bodily injury and health | 71 615 | 75 238 | 76 350 | 96 579 | 116 637 | 18.54% |
Fire and other property damage | 45 746 | 50 821 | 50 536 | 61 908 | 56 529 | 8.99% |
Marine | 29 838 | 30 457 | 27 948 | 31 376 | 34 996 | 5.56% |
Miscellaneous accident | 14 773 | 11 185 | 13 141 | 14 894 | 15 843 | 2.52% |
Third party liability | 8 500 | 8 634 | 10 045 | 10 687 | 12 324 | 1.96% |
Acceptances | - | - | - | 251 | 1 701 | 0.27% |
Total non-life | 252 917 | 266 675 | 276 745 | 325 196 | 359 069 | 57.08% |
Life | 204 436 | 199 059 | 213 331 | 269 590 | 269 878 | 42.92% |
| Grand total | 457 353 | 465 734 | 490 076 | 594 786 | 628 947 | 100% |
Breakdown of 2018 turnover per class of business
The Ivorian life insurance market: Loss ratio per class of business in 2018
Figures in thousands| Incurred losses | Earned premiums | Loss ratio | |||
|---|---|---|---|---|---|
| In FCFA | In USD | In FCFA | In USD | ||
Bodily injury and health | 45 516 191 | 79 198 | 65 907 527 | 114 679 | 69.06% |
Motor | 28 278 020 | 49 204 | 68 262 562 | 118 777 | 41.43% |
Fire and other property damage | 18 899 352 | 32 885 | 32 484 230 | 56 523 | 58.18% |
Third party liability | 305 385 | 531 | 6 943 996 | 12 083 | 4.40% |
Marine | 3 118 689 | 5 427 | 20 089 754 | 34 956 | 15.52% |
Miscellaneous accident | 3 103 656 | 5 400 | 9 237 462 | 16 073 | 33.60% |
Acceptances | 320 285 | 557 | 881 187 | 1 533 | 36.35% |
| Total non-life | 99 541 577 | 173 202 | 203 806 718 | 354 624 | 48.84% |
The Ivorian life insurance market: Net management expenses ratio per class of business in 2018
| Acquisition and administration costs | Written premiums | Management expenses ratio | |||
|---|---|---|---|---|---|
| In FCFA | In USD | In FCFA | In USD | ||
Bodily injury and health | 21 484 708 | 37 383 | 67 033 029 | 116 637 | 32.05% |
Motor | 31 827 513 | 55 380 | 69 562 491 | 121 039 | 45.75% |
Fire and other property damage | 10 788 135 | 18 771 | 32 488 098 | 56 529 | 33.21% |
Third party liability | 3 018 148 | 5 252 | 7 082 716 | 12 324 | 42.61% |
Marine | 5 520 081 | 9 605 | 20 112 749 | 34 996 | 27.45% |
Miscellaneous accident | 3 651 336 | 6 353 | 9 104 961 | 15 843 | 40.10% |
Acceptances | 184 128 | 320 | 977 489 | 1 701 | 18.84% |
| Total non-Life | 76 474 049 | 133 065 | 206 361 533 | 359 069 | 37.06% |
The Ivorian life insurance market: Technical ratios per class of business in 2018
| Loss ratio | Management expenses ratio | Combined ratio | |
|---|---|---|---|
Bodily injury and health | 69.06% | 32.05% | 101.11% |
Motor | 41.43% | 45.75% | 87.18% |
Fire and other property damage | 58.18% | 33.21% | 91.39% |
Third party liability | 4.40% | 42.61% | 47.01% |
Marine | 15.52% | 27.45% | 42.97% |
Miscellaneous accident | 33.60% | 40.10% | 73.70% |
Acceptances | 36.35% | 18.84% | 55.19% |
| Total non-life | 48.84% | 37.06% | 85.90% |
Source: Côte d’Ivoire’s association of insurance comapnies « ASA-CI »
Exchange rate FCFA/USD as at 31/12 | 2014 | 2015 | 2016 | 2017 | 2018 |
0.00174 | 0.00183 | 0.00161 | 0.00167 | 0.00185 |
Read also: Ranking of Ivorian insurers in 2017 [5]