
- Date of creation: 12 June 1962, Kuwait
- Class of business: Life and non-life
- Regional structures: 9 local branches and 1 subsidiary*: Kuwait Re (Kuwait)
- Rating:
- A.M. Best : A- Stable
- Moody’s : A3 Stable
- Standard & Poor’s : A- Negative
* The Trade Union Holding (Bahrain) ceased its activities
Al Ahleia Insurance Company in 2019
 |  |
Ayman A. Al-Shayea Chairman of the board | Yousef S. Al-Saad CEO |
Share capital | 65 796 600 USD |
Turnover | 321 962 822 USD |
Total assets | 1 031 042 295 USD |
Shareholder’s equity | 392 330 052 USD |
Net-result | 35 657 331 USD |
Net non-life loss ratio | 74.20% |
Net non-life management expenses ratio | 51.92% |
Non-life combined ratio | 126.12% |
Management
| Ayman Abdullatif Al-Shayea | Chairman of the board |
| Yousef S. Al-Saad | Chief Executive Officer (CEO) |
| Mohammad A. Al-Saad | Vice CEO |
| Jamal Y. Al-Houlli | Vice CEO, Motor Department |
| Jawad R. Saleh | Vice CEO, Life and Medical Department |
| Ghazi A. Al-Roumi | Vice CEO, Production and Branches Department |
| Mohammad A. Samour | Vice CEO, Marine and Aviation Department |
| Fayeq H. Tawdros | Actuary |
Main sharehoders
| Stock market investments | 91.92% |
| National Industries Group Hold. & Group (Ikarus Petroleum Industries, Noor Financial Investment CO. & Pearl National Hold.) | 8.08% |
Read also | Top 10 insurance companies in Kuwait [4]
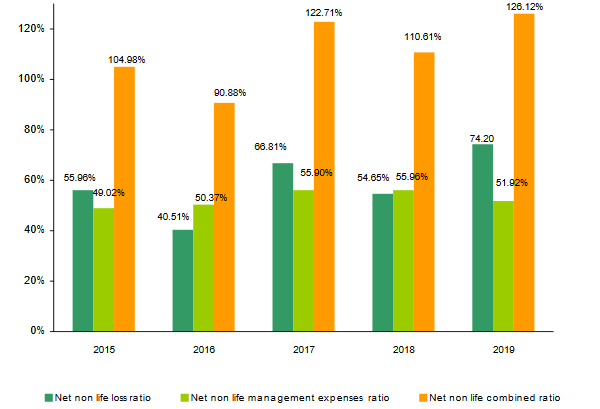
Al Ahleia Insurance Company: Main technical highlights (2015-2019)
Figures in USD| 2015 | 2016 | 2017 | 2018 | 2019 | |
|---|---|---|---|---|---|
| Gross written premiums | 142 619 186 | 201 575 010 | 237 728 478 | 275 424 664 | 321 962 822 |
| Reinsurance premiums (1) | 33 113 813 | 95 895 486 | 115 822 514 | 152 687 685 | 187 404 952 |
| Net written premiums | 63 388 484 | 122 037 529 | 167 202 393 | 197 940 864 | 236 253 022 |
| Net earned premiums | 98 946 641 | 137 699 694 | 160 362 661 | 190 113 929 | 217 698 381 |
| Net incurred losses | 54 494 466 | 82 117 232 | 113 897 180 | 130 092 025 | 162 385 983 |
| Management expenses | 41 162 905 | 51 112 732 | 49 247 804 | 55 578 697 | 58 407 928 |
| Net non-life loss ratio (2) | 55.96% | 40.51% | 66.81% | 54.65% | 74.20% |
| Net non-life management expenses ratio (3) | 49.02% | 50.37% | 55.90% | 55.96% | 51.92% |
| Net non-life combined ratio (4) | 104.98% | 90.88% | 122.71% | 110.61% | 126.12% |
| Net result | 37 339 772 | 30 019 445 | 29 220 101 | 32 691 255 | 35 657 331 |
(1) The underwriting of reinsurance operations is achieved by Kuwait Re
(2) Net non life loss ratio = Net non life incurred losses / net non life earned premiums
(3) Net non life management expenses ratio = Non life management expenses / Net non life written premiums
(4) Net non life combined ratio = Net non life loss ratio + Net non life management expenses ratio
The loss ratio and the management expenses ratio are computed for non life insurance, excluding, life, health and reinsurance.
Al Ahleia Insurance Company: Turnover breakdown per class of business (2015-2019)
Figures in USD| 2015 | 2016 | 2017 | 2018 | 2019 | 2019 shares | |
|---|---|---|---|---|---|---|
Accident | 40 779 920 | 41 165 850 | 42 515 373 | 34 204 686 | 38 263 467 | 11.88% |
Marine and aviation | 23 362 870 | 18 475 966 | 18 955 266 | 24 080 258 | 27 342 889 | 8.49% |
Fire | 16 698 534 | 16 376 826 | 16 854 874 | 17 706 144 | 19 694 873 | 6.12% |
Total non life | 80 841 324 | 76 018 642 | 78 325 513 | 75 991 088 | 85 301 229 | 26.49% |
Life and medical | 28 664 049 | 29 660 882 | 52 951 825 | 54 476 256 | 58 356 061 | 18.13% |
Total insurance premiums | 109 505 373 | 105 679 524 | 131 277 338 | 130 467 344 | 143 657 290 | 44.62% |
Reinsurance premiums | 33 113 813 | 95 895 486 | 115 822 514 | 152 687 685 | 187 404 952 | 58.21% |
Other operations * | - | - | -9 371 374 | -7 730 365 | -9 099 420 | -2.83% |
Grand total | 142 619 186 | 201 575 010 | 237 728 478 | 275 424 664 | 321 962 822 | 100% |
* Intercompany transactions
Breakdown of 2019 turnover per class of business
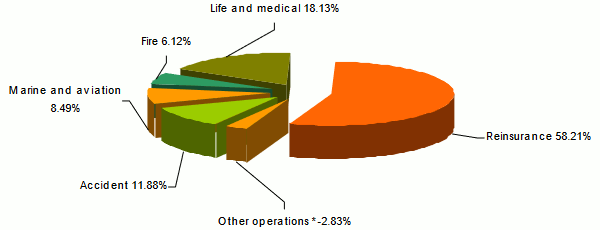
* Intercompany transactions
Al Ahleia Insurance Company: Net written premiums per class of business (2015 - 2019)
Figures in USD| 2015 | 2016 | 2017 | 2018 | 2019 | 2018-2019 evolution* | |
|---|---|---|---|---|---|---|
Accident | 21 275 309 | 19 125 391 | 17 605 114 | 16 376 256 | 17 690 771 | 7.69% |
Marine and aviation | 5 029 364 | 5 207 227 | 5 000 522 | 5 490 784 | 4 800 221 | -12.85% |
Fire | 2 511 939 | 2 525 065 | 2 093 189 | 1 789 118 | 1 658 982 | -7.56% |
Total nonlife | 28 816 612 | 26 857 683 | 24 698 825 | 23 656 158 | 24 149 974 | 1.77% |
Life and health | 10 216 632 | 11 676 364 | 38 557 511 | 41 796 536 | 46 706 236 | 11.40% |
Total insurance premiums | 39 033 244 | 38 534 047 | 63 256 336 | 65 452 694 | 70 856 210 | 7.91% |
Reinsurance premiums | 24 355 240 | 83 503 482 | 103 946 057 | 132 488 170 | 165 396 812 | 24.45% |
Grand total | 63 388 484 | 122 037 529 | 167 202 393 | 197 940 864 | 236 253 022 | 18.98% |
* Evolution in local currency
Al Ahleia Insurance Company : Net earned premiums per class of business (2015-2019)
Figures in USD| 2015 | 2016 | 2017 | 2018 | 2019 | Evolution 2018-2019* | |
|---|---|---|---|---|---|---|
Accident | 23 126 129 | 19 617 753 | 18 471 401 | 16 473 692 | 16 595 432 | 0.42% |
Marine and aviation | 4 709 645 | 5 112 643 | 4 847 809 | 5 534 353 | 4 698 381 | -15.37% |
Fire | 2 575 060 | 2 491 064 | 2 258 270 | 1 902 079 | 1 633 831 | -14.37% |
Total non life | 30 410 834 | 27 221 460 | 25 577 480 | 23 910 124 | 22 927 644 | -4.41% |
Life and medical | 10 216 632 | 11 676 364 | 38 557 511 | 41 796 536 | 46 706 236 | 11.40% |
Total insurance premiums | 40 627 466 | 38 897 824 | 64 134 991 | 65 706 660 | 69 633 880 | 5.65% |
Reinsurance premiums | 58 319 175 | 98 801 870 | 96 227 670 | 124 407 269 | 148 064 501 | 18.64% |
Grand total | 98 946 641 | 137 699 694 | 160 362 661 | 190 113 929 | 217 698 381 | 14.15% |
* Evolution in local currency
Al Ahleia Insurance Company: Net incurred losses (2015-2019)
Figures in USD| 2015 | 2016 | 2017 | 2018 | 2019 | 018-2019 evolution* | |
|---|---|---|---|---|---|---|
Accident | 14 338 000 | 9 490 097 | 11 503 333 | 10 937 680 | 12 909 944 | 17.66% |
Marine and aviation | 1 640 354 | 1 714 065 | 3 256 882 | 1 304 714 | 3 322 413 | 153.85% |
Fire | 1 040 511 | -178 036 | 2 328 502 | 823 511 | 779 318 | -5.66% |
Total non-life | 17 018 865 | 11 026 126 | 17 088 717 | 13 065 905 | 17 011 675 | 29.79% |
Life and health | 6 377 503 | 7 289 750 | 34 362 357 | 35 485 639 | 44 798 339 | 25.85% |
Direct insurance | 23 396 368 | 18 315 876 | 51 451 074 | 48 551 544 | 61 810 014 | 26.91% |
Reinsurance | 31 098 098 | 63 801 356 | 62 446 106 | 81 540 481 | 100 575 969 | 22.96% |
Grand total | 54 494 466 | 82 117 232 | 113 897 180 | 130 092 025 | 162 385 983 | 24.43% |
* Evolution in local currency
Al Ahleia Insurance Company: Management expenses per class of business (2015-2019)
| 2015 | 2016 | 2017 | 2018 | 2019 | 2018-2019 evolution* | |
|---|---|---|---|---|---|---|
Accident | 8 141 202 | 7 695 027 | 8 232 663 | 7 087 329 | 6 267 827 | -11.84% |
Marine and aviation | 4 016 884 | 3 344 578 | 3 522 903 | 3 790 493 | 4 068 773 | 7.01% |
Fire | 1 968 066 | 2 487 523 | 2 050 750 | 2 360 811 | 2 203 081 | -6.97% |
Total non life | 14 126 152 | 13 527 128 | 13 806 316 | 13 238 633 | 12 539 681 | -5.58% |
Life and health | 2 911 975 | 4 890 393 | 2 863 057 | 2 975 909 | 3 305 420 | 10.73% |
Direct insurance | 17 038 127 | 18 417 521 | 16 669 373 | 16 214 542 | 15 845 101 | -2.58% |
Reinsurance | 24 124 778 | 32 695 211 | 33 701 907 | 40 044 152 | 43 570 367 | 8.47% |
Other operations (1) | - | - | -1 123 476 | -679 997 | -1 007 540 | 47.71% |
Total général | 41 162 905 | 51 112 732 | 49 247 804 | 55 578 697 | 58 407 928 | 4.76% |
* Evolution in local currency
1 Intercompany transactions
Al Ahleia Insurance Company: Net loss ratio per class of business (2015-2019)
| 2015 | 2016 | 2017 | 2018 | 2019 | |
|---|---|---|---|---|---|
Accident | 62.00% | 48.38% | 62.28% | 66.39% | 77.79% |
Marine and aviation | 34.83% | 33.53% | 67.18% | 23.57% | 70.71% |
Fire | 40.41% | -7.15% | 103.11% | 43.30% | 47.70% |
Total non life | 55.96% | 40.51% | 66.81% | 54.65% | 74.20% |
Life and health | 62.42% | 62.43% | 89.12% | 84.90% | 95.92% |
Total direct insurance | 57.59% | 47.09% | 80.22% | 73.89% | 88.76% |
Reinsurance | 53.32% | 64.58% | 64.89% | 65.54% | 67.93% |
Grand total | 55.07% | 59.64% | 71.02% | 68.43% | 74.59% |
Al Ahleia Insurance Company: Net management expenses ratio per class of business (2015-2019)
| 2015 | 2016 | 2017 | 2018 | 2019 | |
|---|---|---|---|---|---|
Accident | 38.27% | 40.23% | 46.76% | 43.28% | 35.43% |
Marine and aviation | 79.87% | 64.23% | 70.45% | 69.03% | 84.76% |
Fire | 78.35% | 98.51% | 97.97% | 131.95% | 132.80% |
Total non life | 49.02% | 50.37% | 55.90% | 55.96% | 51.92% |
Life and health | 28.50% | 41.88% | 7.43% | 7.12% | 7.08% |
Total direct insurance | 43.65% | 47.80% | 26.35% | 24.77% | 22.36% |
Reinsurance | 99.05% | 39.15% | 32.42% | 30.22% | 26.34% |
Grand total | 64.94% | 41.88% | 29.45% | 28.08% | 24.72% |
Al Ahleia Insurance Company: Net combined ratio per class of business (2015-2019)
| 2015 | 2016 | 2017 | 2018 | 2019 | |
|---|---|---|---|---|---|
Accident | 100.27% | 88.61% | 109.04% | 109.67% | 113.22% |
Marine and aviation | 114.70% | 97.76% | 137.63% | 92.60% | 155.47% |
Fire | 118.76% | 91.36% | 201.08% | 175.25% | 180.50% |
Total non life | 104.98% | 90.88% | 122.71% | 110.61% | 126.12% |
Life and medical | 90.92% | 104.31% | 96.55% | 92.02% | 103.00% |
Total direct insurance | 101.24% | 94.89% | 106.57% | 98.66% | 111.12% |
Reinsurance | 152.37% | 103.73% | 97.31% | 95.76% | 94.27% |
Grand total | 120.01% | 101.52% | 100.47% | 96.51% | 99.31% |
Exchange rate KWD/USD as at 31/12 | 2015 | 2016 | 2017 | 2018 | 2019 |
3.28926 | 3.26307 | 3.30268 | 3.27956 | 3.28983 |

Al Ahleia Insurance Company : Contact
| Head office | Ahmad Al-Jaber Street — Al Ahleia Insurance Tower, Al-Sharq, Koweït. P.O. Box 1602 Safat, 13017 |
| Phone | +965 1888 444 |
| Website | www.alahleia.com [6] |