The Zimbabwean insurance market

Insurance market features
- Regulatory authority: Insurance and Pensions Commission
- Life premiums(2013): 261 860 000 USD
- Non life premiums (2013): 209 837 000 USD
- Life and non life premiums(2013): 471 697 000 USD
- Insurance density (2013): 35.7 USD
- Penetration rate (2013): 4.5%
Insurance market structure 2013*
Market actors | Life | Non life | Total |
|---|---|---|---|
Insurance companies1 | 10 | 29 | 39 |
Reinsurance companies | 2 | 10 | 12 |
Insurance brokers | - | 30 | 30 |
Reinsurance brokers | - | 3 | 3 |
Total | 12 | 72 | 84 |
1 among the 29 authorized non life companies, five are not yet operational
Country profile
- Area: 390 757 km2
- Population (2013): 13 182 908 inhabitants
- GDP (2013): 10.48 billion USD
- GDP per capita (2013): 795 USD
- GDP growth rate (2013): 3.2%
- Inflation rate(2013): 8.5%
- Main economic sectors: mining (coal, gold, platinum, copper, nickel, tin, clay, ore), metallurgy industry, wood, chemicals and fertilisers, textile and shoes, food industry and beverages.
Main cities
(per number of inhabitants in 2012)
- Harare (capital): 1 485 231
- Bulawayo: 653 337
- Chitungwiza: 356 840
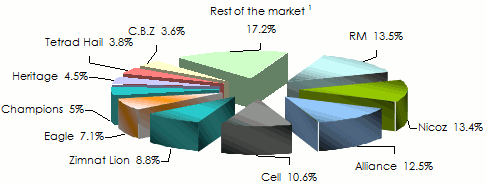
Premiums and results per non life company in 2013
in thousands USD| Gross written premiums | Market shares | Net written premiums | Technical result | Net result | |
|---|---|---|---|---|---|
RM | 28 350 | 13.5% | 19 565 | 8 480 | 4 423 |
Nicoz | 28 065 | 13.4% | 16 748 | 5 958 | 1 014 |
Alliance | 26 313 | 12.5% | 9 087 | 4 704 | 768 |
Cell | 22 188 | 10.6% | 8 937 | 6 160 | 1 714 |
Zimnat Lion | 18 502 | 8.8% | 8 970 | 4 059 | 1 086 |
Eagle | 14 894 | 7.1% | 7 142 | 4 201 | 1 494 |
Champions | 10 459 | 5% | 3 746 | 3 167 | 530 |
Heritage | 9 475 | 4.5% | 4 611 | 2 605 | 247 |
Tetrad Hail | 7 969 | 3.8% | 3 458 | 1 054 | 524 |
C.B.Z | 7 562 | 3.6% | 3 507 | 2 231 | 458 |
Tristar | 7 051 | 3.4% | 3 665 | 1 818 | -929 |
Credsure | 5 035 | 2.4% | 2 903 | 1 654 | -450 |
Altfin | 4 656 | 2.2% | 3 115 | 2 136 | -103 |
Clarion | 3 961 | 1.9% | 3 744 | 1 583 | 277 |
Evolution | 3 660 | 1.7% | 1 953 | 837 | 182 |
Quality | 2 297 | 1.1% | 1 939 | 475 | 359 |
Global | 2 076 | 1% | 1 483 | 644 | 74 |
Allied | 1 873 | 0.9% | 1 479 | 655 | 486 |
Hamilton | 1 647 | 0.8% | 836 | 909 | 217 |
Regal | 1 558 | 0.7% | 1 541 | 915 | 38 |
KMFS | 916 | 0.4% | 804 | 383 | 145 |
Excellence | 777 | 0.4% | 650 | 308 | 442 |
Sanctuary | 551 | 0.3% | 401 | 110 | -878 |
Safel | 2 | - | - | - | -95 |
Total | 209 837 | 100% | 110 284 | 55 046 | 12 023 |
 1 14 companies
 Non life turnover per class of business: 2012-2013
in thousands USD| 2012 | 2013 | 2012/2013 evolution | 2013 shares | |
|---|---|---|---|---|
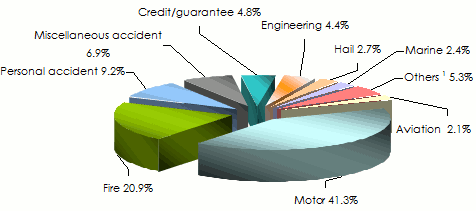
Motor | 79 161 | 86 622 | 9.4% | 41.3% |
Fire | 41 059 | 43 915 | 7% | 20.9% |
Personal accident | 17 302 | 19 208 | 11% | 9.2% |
Miscellaneous accident | 14 339 | 14 491 | 1.1% | 6.9% |
Credit/guarantee | 6 527 | 10 036 | 53.8% | 4.8% |
Engineering | 10 082 | 9 202 | -8.7% | 4.4% |
Hail | 5 556 | 5 668 | 2% | 2.7% |
Marine | 5 985 | 5 055 | -15.5% | 2.4% |
Aviation | 4 255 | 4 482 | 5.3% | 2.1% |
Others 1 | 9 731 | 11 158 | 14.66% | 5.3% |
Total | 193 997 | 209 837 | 8.2% | 100% |
Breakdown of non life turnover pers class of business in 2013
 1 including agricultural risks, third party liability and health
 Premiums, incurred losses and management expenses of the top ten non life insurance companies in 2013
in thousands USD| Net earned premiums | Net incurred losses | Gross written premiums | Management expenses 1 | |
|---|---|---|---|---|
RM | 18 841 | 8 426 | 28 350 | 6 983 |
Nicoz | 15 305 | 7 442 | 28 065 | 7 042 |
Alliance | 10 071 | 5 231 | 26 313 | 4 410 |
Cell | 8 941 | 2 941 | 22 188 | 5 751 |
Zimnat Lion | 7 862 | 3 255 | 18 502 | 3 746 |
Eagle | 7 058 | 2 604 | 14 894 | 2 688 |
Champions | 4 256 | 1 114 | 10 459 | 3 113 |
Heritage | 4 655 | 2 001 | 9 475 | 2 570 |
Tetrad Hail | 1 279 | 1 005 | 7 969 | 2 688 |
C.B.Z | 3 263 | 1 112 | 7 562 | 1 605 |
Total of the top ten companies | 81 531 | 35 131 | 173 777 | 40 596 |
Rest of the market 2 | 23 989 | 10 502 | 36 060 | 12 241 |
Grand total | 105 520 | 45 633 | 209 837 | 52 837 |
2 14 companies
Technical ratios of the top ten non life insurance companies in 2013
| Net loss ratio | Expenses ratio 1 | Combined ratio | |
|---|---|---|---|
RM | 44.7% | 24.6% | 69.3% |
Nicoz | 48.6% | 25.1% | 73.7% |
Alliance | 51.9% | 16.8% | 68.7% |
Cell | 32.9% | 25.9% | 58.8% |
Zimnat Lion | 41.4% | 20.2% | 61.6% |
Eagle | 36.9% | 18% | 54.9% |
Champions | 26.2% | 29.8% | 56% |
Heritage | 43% | 27.1% | 70.1% |
Tetrad Hail | 78.6% | 33.7% | 112.3% |
C.B.Z | 34.1% | 21.2% | 55.3% |
Total of the top ten companies | 43.1% | 23.4% | 66.5% |
Rest of the market 2 | 43.8% | 33.9% | 77.7% |
Grand total | 43.2% | 25.2% | 68.4% |
214 companies
Gross written premiums per life insurance company:
2012-2013
in thousands USD| 2012 | 2013 | 2012/2013 evolution | 2013 shares | |
|---|---|---|---|---|
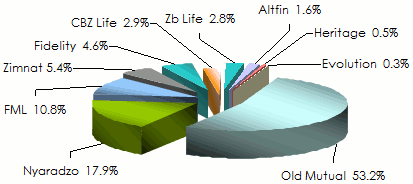
Old Mutual | 134 652 | 139 197 | 3.4% | 53.2% |
Nyaradzo | - | 46 778 | - | 17.9% |
FML | 22 305 | 28 396 | 27.3% | 10.8% |
Zimnat | 12 338 | 14 245 | 15.4% | 5.4% |
Fidelity | 8 801 | 11 971 | 36.0% | 4.6% |
CBZ Life | 4 138 | 7 666 | 85.3% | 2.9% |
Zb Life | 6 897 | 7 358 | 6.7% | 2.8% |
Altfin | 4 550 | 4 187 | -8.0% | 1.6% |
Heritage | 1 081 | 1 410 | 30.4% | 0.5% |
Evolution | 1 296 | 652 | -49.7% | 0.3% |
Total | 196 058 | 261 860 | 33.6% | 100% |
Market shares of life insurance companies in 2013
Net written premiums per life insurance company:
2012-2013
in thousands USD| 2012 | 2013 | 2012/2013 evolution | 2013 shares | |
|---|---|---|---|---|
Old Mutual | 134 202 | 138 384 | 3.1% | 53.6% |
Nyaradzo | - | 46 778 | - | 18.1% |
FML | 22 189 | 28 139 | 26.8% | 10.9% |
Zimnat | 11 765 | 13 354 | 13.5% | 5.2% |
Fidelity | 8 520 | 11 582 | 35.9% | 4.5% |
CBZ Life | 3 907 | 7 464 | 91.0% | 2.9% |
Zb Life | 6 460 | 6 779 | 4.9% | 2.6% |
Altfin | 3 989 | 3 668 | -8.0% | 1.4% |
Heritage | 1 016 | 1 362 | 34.1% | 0.5% |
Evolution | 558 | 653 | 17.0% | 0.3% |
Total | 192 606 | 258 163 | 34.0% | 100% |
Life insurance turnover per class of business: 2012-2013
in thousands USD| 2012 | 2013 | 2013 shares | |
|---|---|---|---|
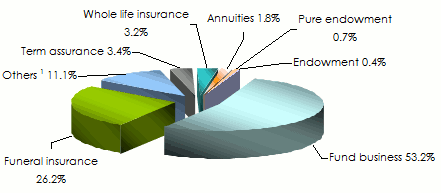
Fund business | 121 874 | 139 307 | 53.2% |
Funeral insurance | 15 411 | 68 675 | 26.2% |
others 1 | 18 293 | 28 987 | 11.1% |
Term assurance | 801 | 8 789 | 3.4% |
Whole life insurance | 14 621 | 8 546 | 3.2% |
Annuities | 24 451 | 4 695 | 1.8% |
Pure endownent | 125 | 1 877 | 0.7% |
Endowment | 482 | 984 | 0.4% |
Total | 196 058 | 261 860 | 100% |
Breakdown of life insurance premiums per class of business in 2013
 1 including group life assurance Source: Insurance and Pension Commision (IPEC), Zimbabwe
- Vous devez vous identifier ou créer un compte pour écrire des commentaires

En continu
10:47
09:40

23/04
23/04
23/04
Dernières news